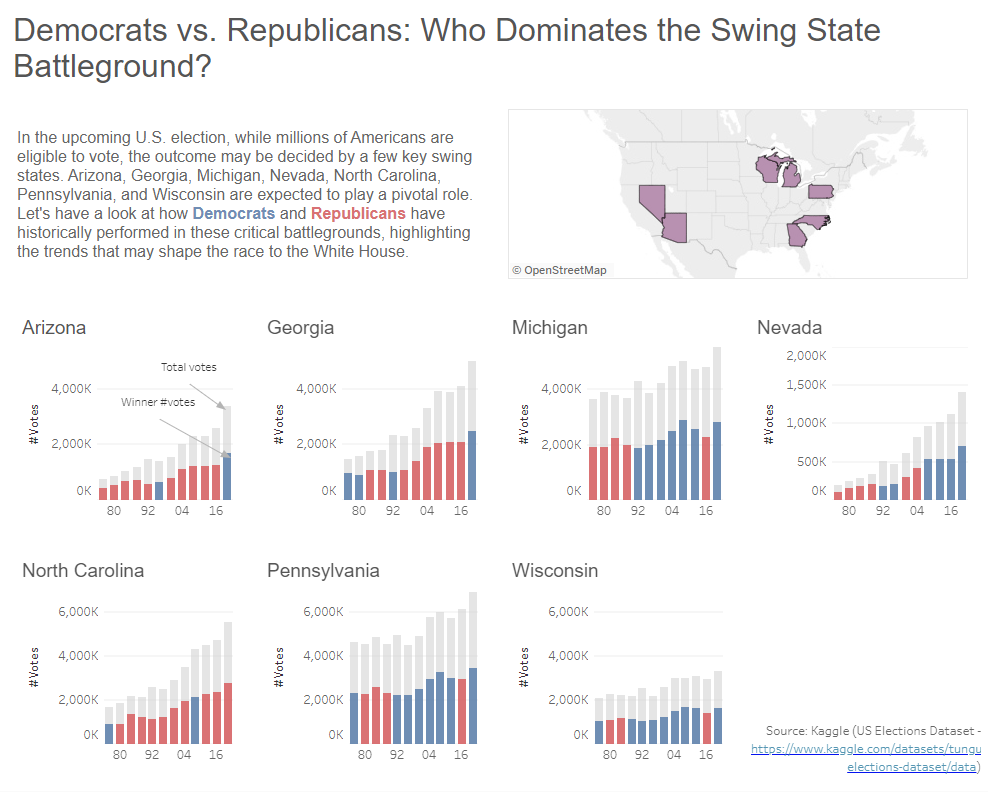
As the U.S. elections approach, it’s clear that their outcome will have a significant impact not only on the country but also on the rest of the world. With that in mind, let’s take a closer look at seven key states that will likely decide the election results—the Swing States.
Swing states, also known as battleground or purple states, are those where both major political parties—Democratic and Republican—have a competitive chance of winning. Unlike safe states, which consistently vote for one party, swing states can shift in favour of either party from one election to the next. This makes them crucial in determining the overall outcome.
Why Focus on Swing States?
To better understand the potential outcome of the upcoming election, it’s helpful to look at the history of election results in these swing states. While each election cycle is unique, and various factors (such as the economy or social issues) will influence voters, a state’s historical voting pattern remains a key indicator of how it may perform in future elections. Many voters tend to maintain consistent political affiliations, so understanding the past can offer valuable insights.
Dataset Overview
For this analysis, I’m using a dataset from #MakeOverMonday 2024, Week 33, which provides detailed information about election results in each U.S. state from 1976 to 2020. The dataset includes the total number of votes cast in each election, along with the number of votes received by each political party.
My primary interest is in visualizing the total votes and the votes received by the winning side in each election. This will help create a clearer picture of which party has historically dominated each swing state and also the level of voter turnout. If a state has consistently leaned toward one party in the past, it may be more likely to do so again in the upcoming election, barring any significant shifts in voter sentiment or external factors.

Why Use Fixed LODs in Tableau?
To visualize only the winners of each election by state, I used Fixed LOD (Level of Detail) Expressions in Tableau. Fixed LODs allow you to calculate values at a specific level of detail, regardless of the dimensions currently present in the view. This is particularly useful when you want to aggregate data at a level that doesn’t change, even if users apply filters or adjust other aspects of the visualization.
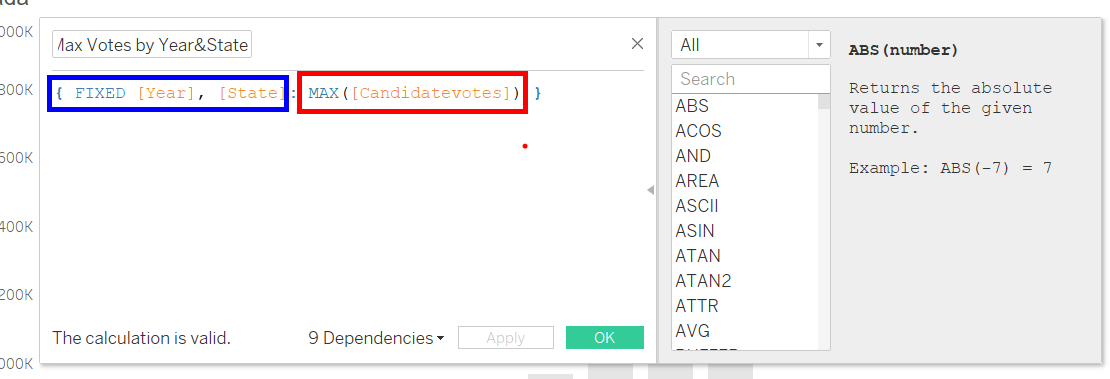
In my case, I needed to instruct Tableau to return the maximum number of votes for each state and year, representing the votes received by the winning candidate.
The Fixed LOD expression I used looks like this:

This ensures that the calculation remains fixed at the state and year level, even if additional filters or dimensions are added to the view.
Filtering to Show Only Election Winners
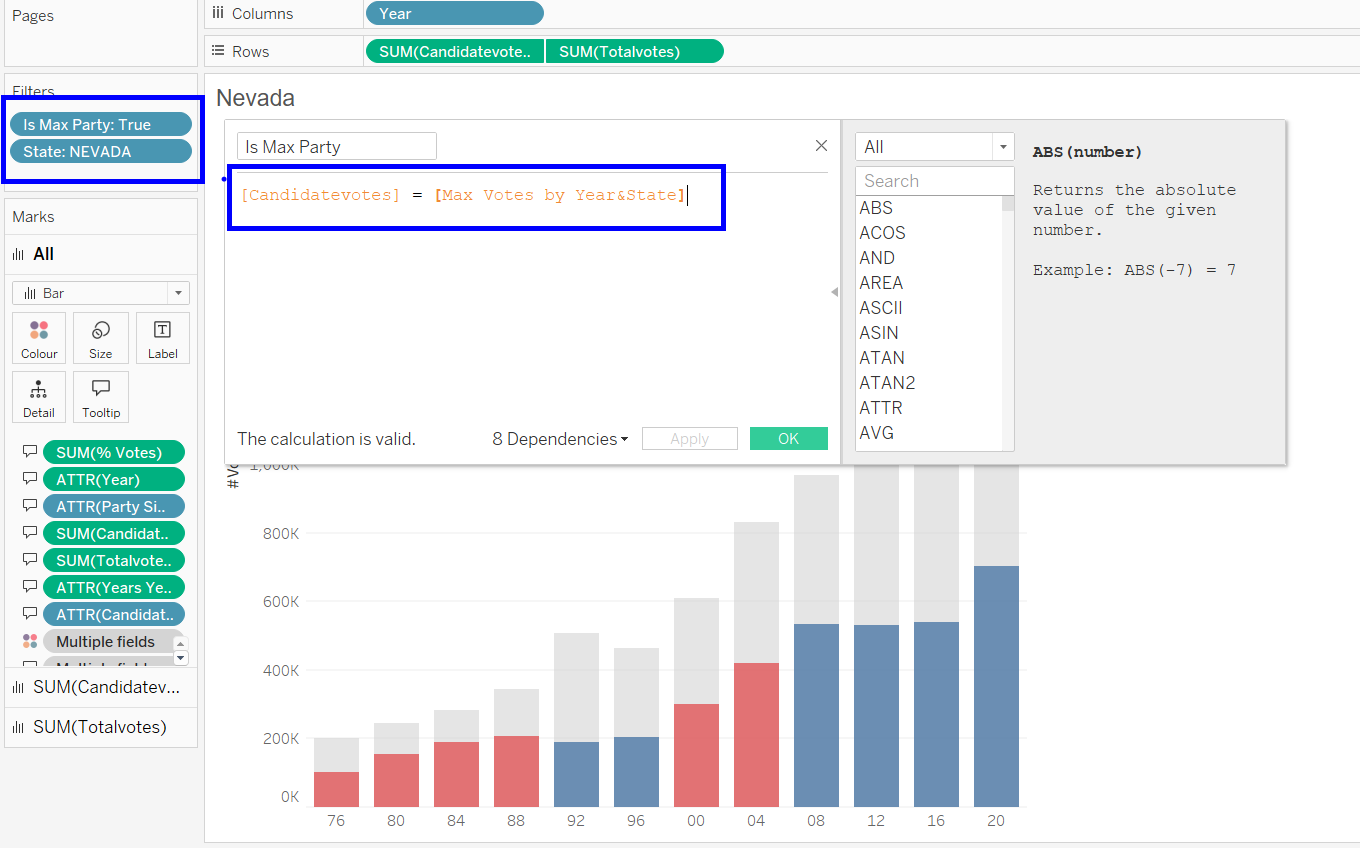
Once I had the maximum number of votes for each state and year, I created a Boolean calculation to filter out the other candidates and display only the election winner. This allowed me to focus solely on the party or candidate who received the most votes in each election, giving a clearer view of past winners.

By visualizing historical election results in this way, we can gain insights into which states are more likely to swing one way or another in the upcoming election. While many factors—such as economic conditions, social issues, and voter turnout—will undoubtedly play a role, a state’s historical voting patterns remain a strong predictor of future outcomes.

