Scatterplots are a powerful tool for visualising the relationship between two variables. They’re particularly useful when you want to compare measures and uncover patterns or correlations. But what happens when your scatterplot is overcrowded with data points? You can’t even hover over individual dots, let alone extract meaningful insights. That’s where the Zoom In feature in Tableau Desktop comes to the rescue.
If you’re here, you’re probably looking for a way to make your scatterplots more interactive and insightful. With the Zoom In feature, you can click on a specific point or select an area on the chart to zoom in, giving yourself and your users the space to explore the data more effectively. It’s not just functional; it makes your visualisations look polished and user-friendly. Let’s dive into how you can create this feature using Tableau Desktop.
We’ll use the Sample Superstore dataset and focus on three variables: Profit Ratio, Discount, and Order Date. To build this feature, you’ll need to create 4 Parameters and set up 4 corresponding Worksheet Actions. Here’s a step-by-step guide to get you started.
Building the Scatterplot
- Add Profit Ratio to Rows (Y-axis)
Start by clicking and dragging the Profit Ratio field into the Rows shelf. This will be your Y-axis. - Add Discount to Columns (X-axis)
Next, drag the Discount field into the Columns shelf. Change the aggregation from Sum to Average to better represent the data distribution.
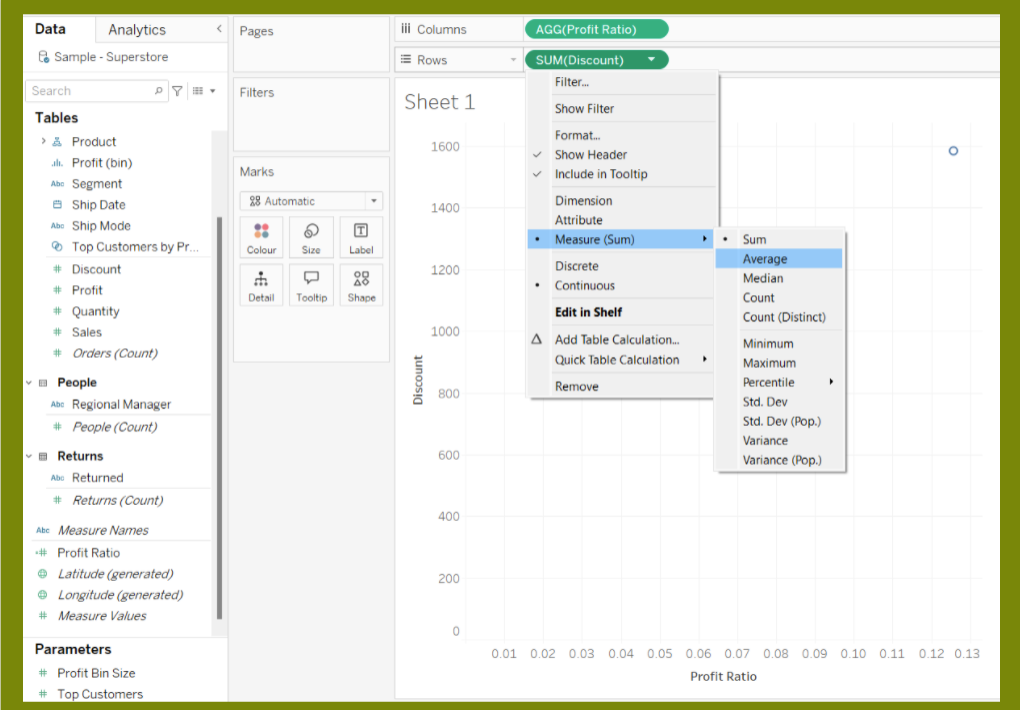
- Add Order Date to Details
Right-click on Order Date, drag it to the Details shelf, and choose Month(Order Date) to see monthly variations.
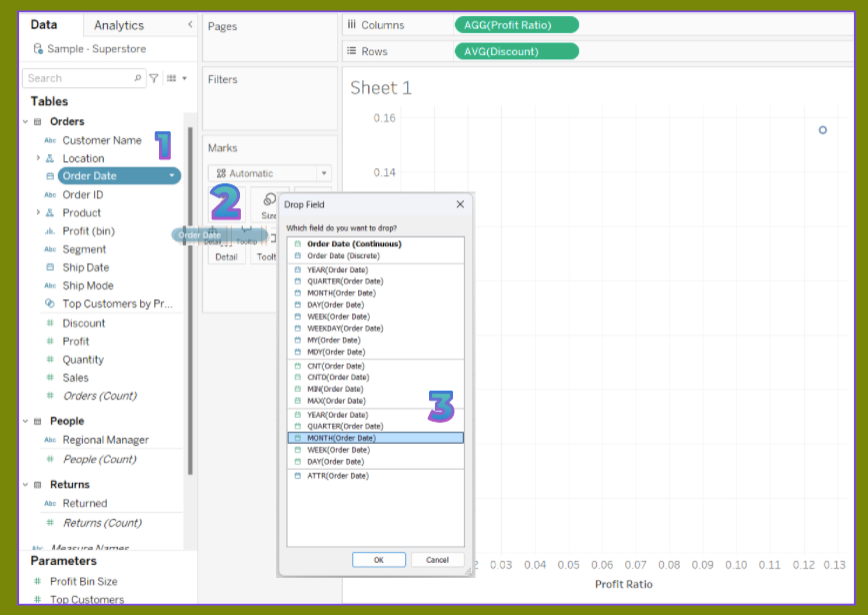
- Change Marks to Circles
Go to the Marks card and change the mark type to Circle. This will make the individual data points more visible and colourful.
Creating Parameters
Now, let’s create the parameters that will control your zoom feature:
- Min Profit Ratio
- Max Profit Ratio
- Min Avg Discount
- Max Avg Discount
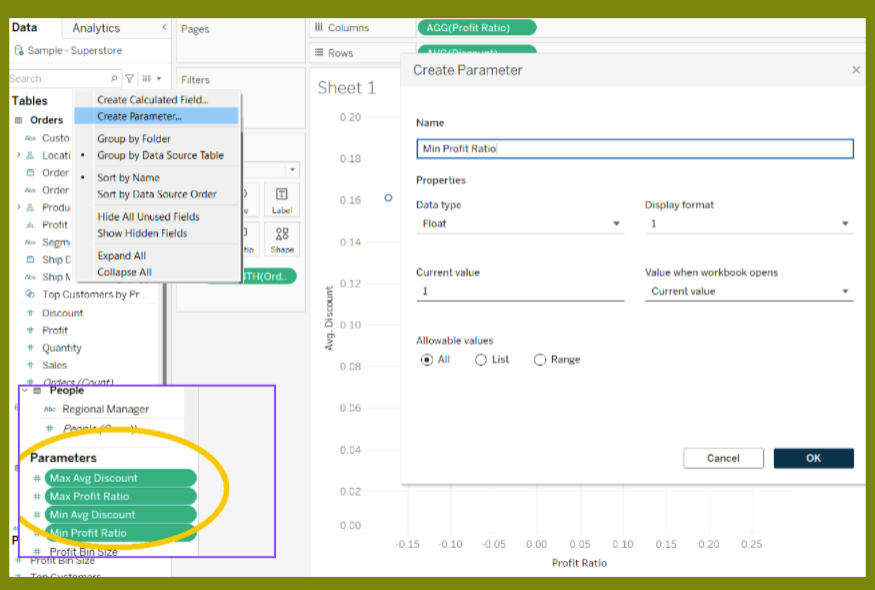
These parameters will allow you to dynamically adjust the axes based on the selected area in your scatterplot.
Adding Worksheet Actions
With the parameters set up, you’ll need to add corresponding actions that change these parameters based on user interaction:
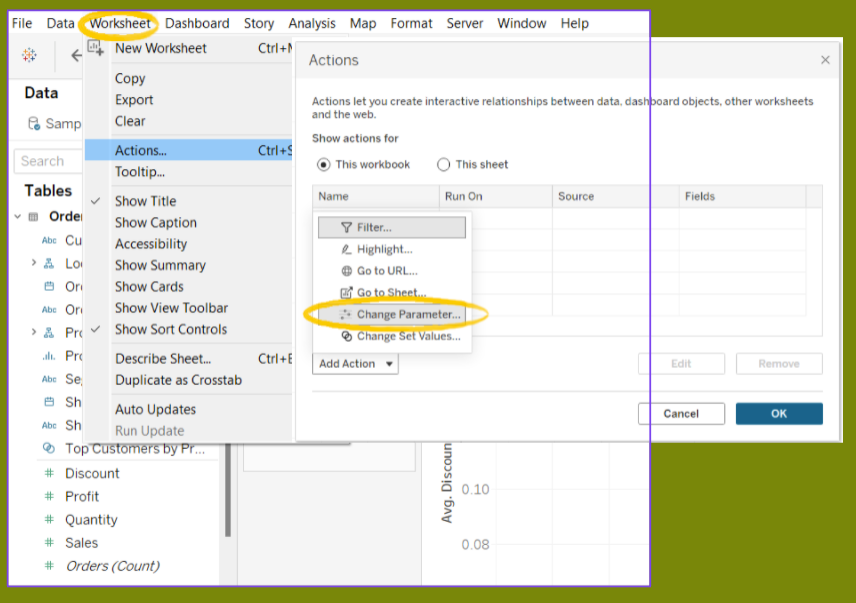
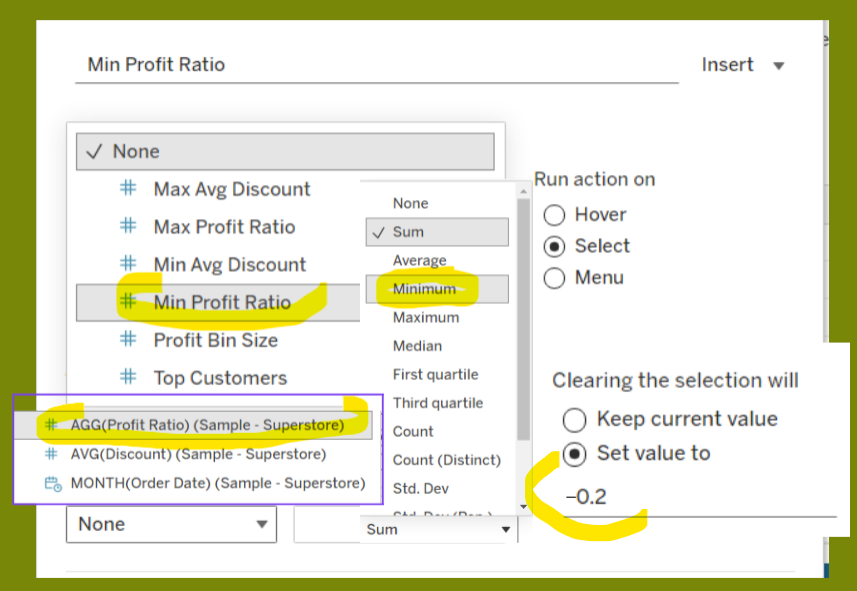
- Min Profit Ratio Action
- Target Parameter: Min Profit Ratio
- Source Field: AGG(Profit Ratio Sample Superstore)
- Aggregation: Minimum
- Clearing: Set Values to -0.2
- Max Profit Ratio Action
- Target Parameter: Max Profit Ratio
- Source Field: AGG(Profit Ratio Sample Superstore)
- Aggregation: Maximum
- Clearing: Set Values to 0.3
- Min Avg Discount Action
- Target Parameter: Min Avg Discount
- Source Field: AGG(Avg Discount Sample Superstore)
- Aggregation: Minimum
- Clearing: Set Values to 0.08
- Max Avg Discount Action
- Target Parameter: Max Avg Discount
- Source Field: AGG(Avg Discount Sample Superstore)
- Aggregation: Maximum
- Clearing: Set Values to 0.2
Modifying the Axes
Finally, you’ll need to modify both the X and Y axes to make them responsive to the zoom:
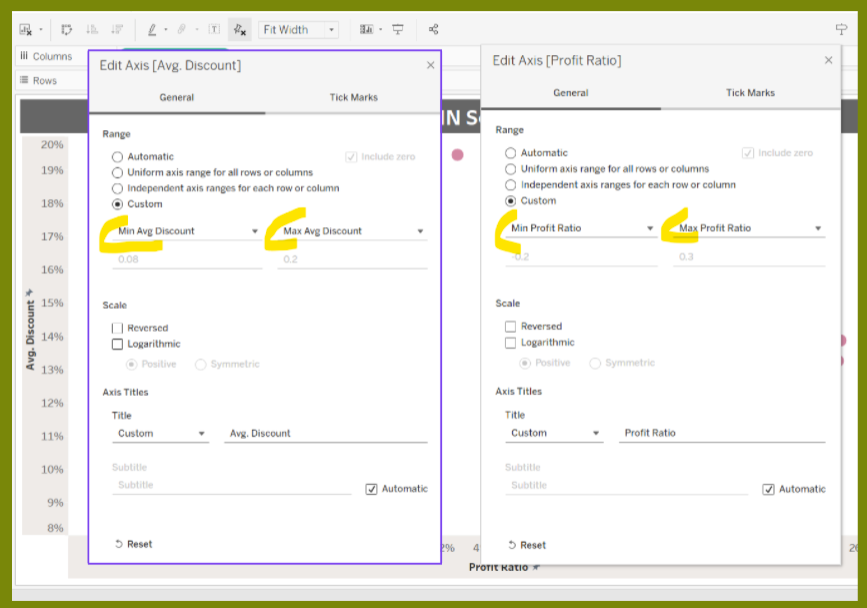
- Customise the Avg Discount Axis (X-axis):
- Double-click on the Avg Discount axis.
- Set the range to custom.
- On the left, select Min Avg Discount.
- On the right, select Max Avg Discount.
- Customise the Profit Ratio Axis (Y-axis):
- Double-click on the Profit Ratio axis.
- Set the range to custom.
- On the left, select Min Profit Ratio.
- On the right, select Max Profit Ratio.
And there you have it! Your scatterplot is now equipped with a Zoom In feature that not only makes your data exploration more interactive but also helps you and your users uncover deeper insights. This functionality will undoubtedly add value to your next Tableau project, making it more intuitive and visually appealing.
