


If you’re looking at this blog you’re probably like me and love to use interactive filters in your dashboards.
It is nice to see how the field you are filtering to compares to the whole while also seeing just the data for what you are filtering for.
You may have also realized that you can hardcode the total, but that’s not elegant so lets not do that.
Here is an example from a marketing dashboard I made. (Icons are just to see this visually probably better as a dropdown)
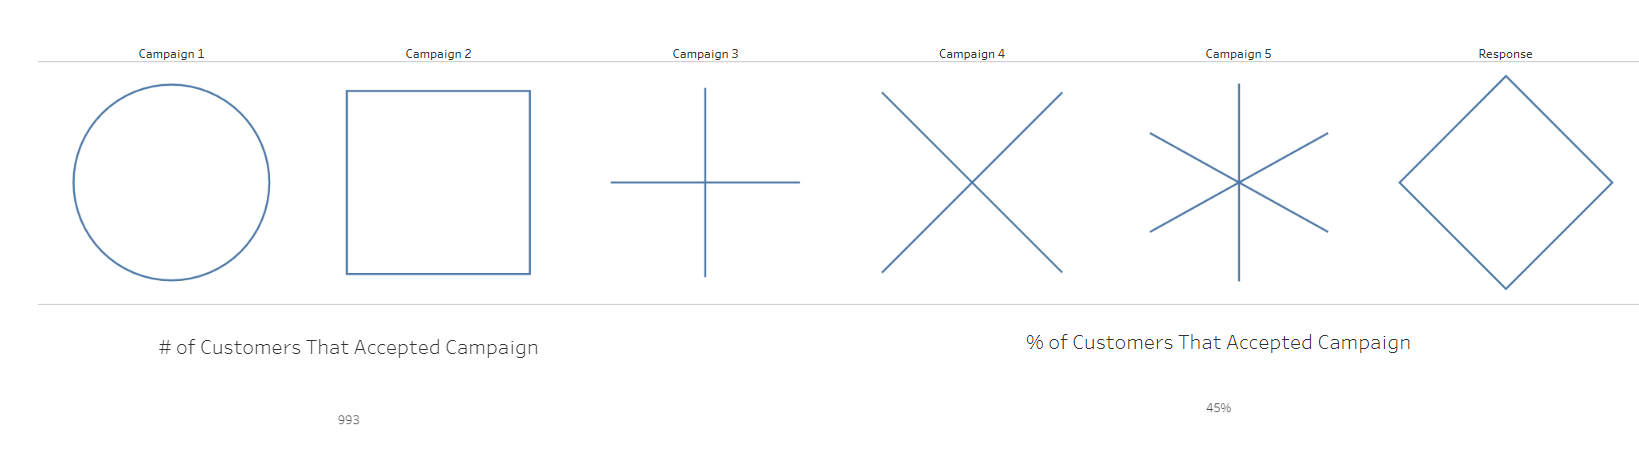
I wanted to be able to look at the demographics of the customers but also see what % of the total customers accepted the campaign. The problem is whenever I clicked on the filter It would filter down to just customers that have accepted the campaign and always be at 100%
Eventually I realized that you can hardcode the total and you may have to, but that’s not elegant so lets not do that.
Here is another dashboard I did in a hour for #MakeOverMonday
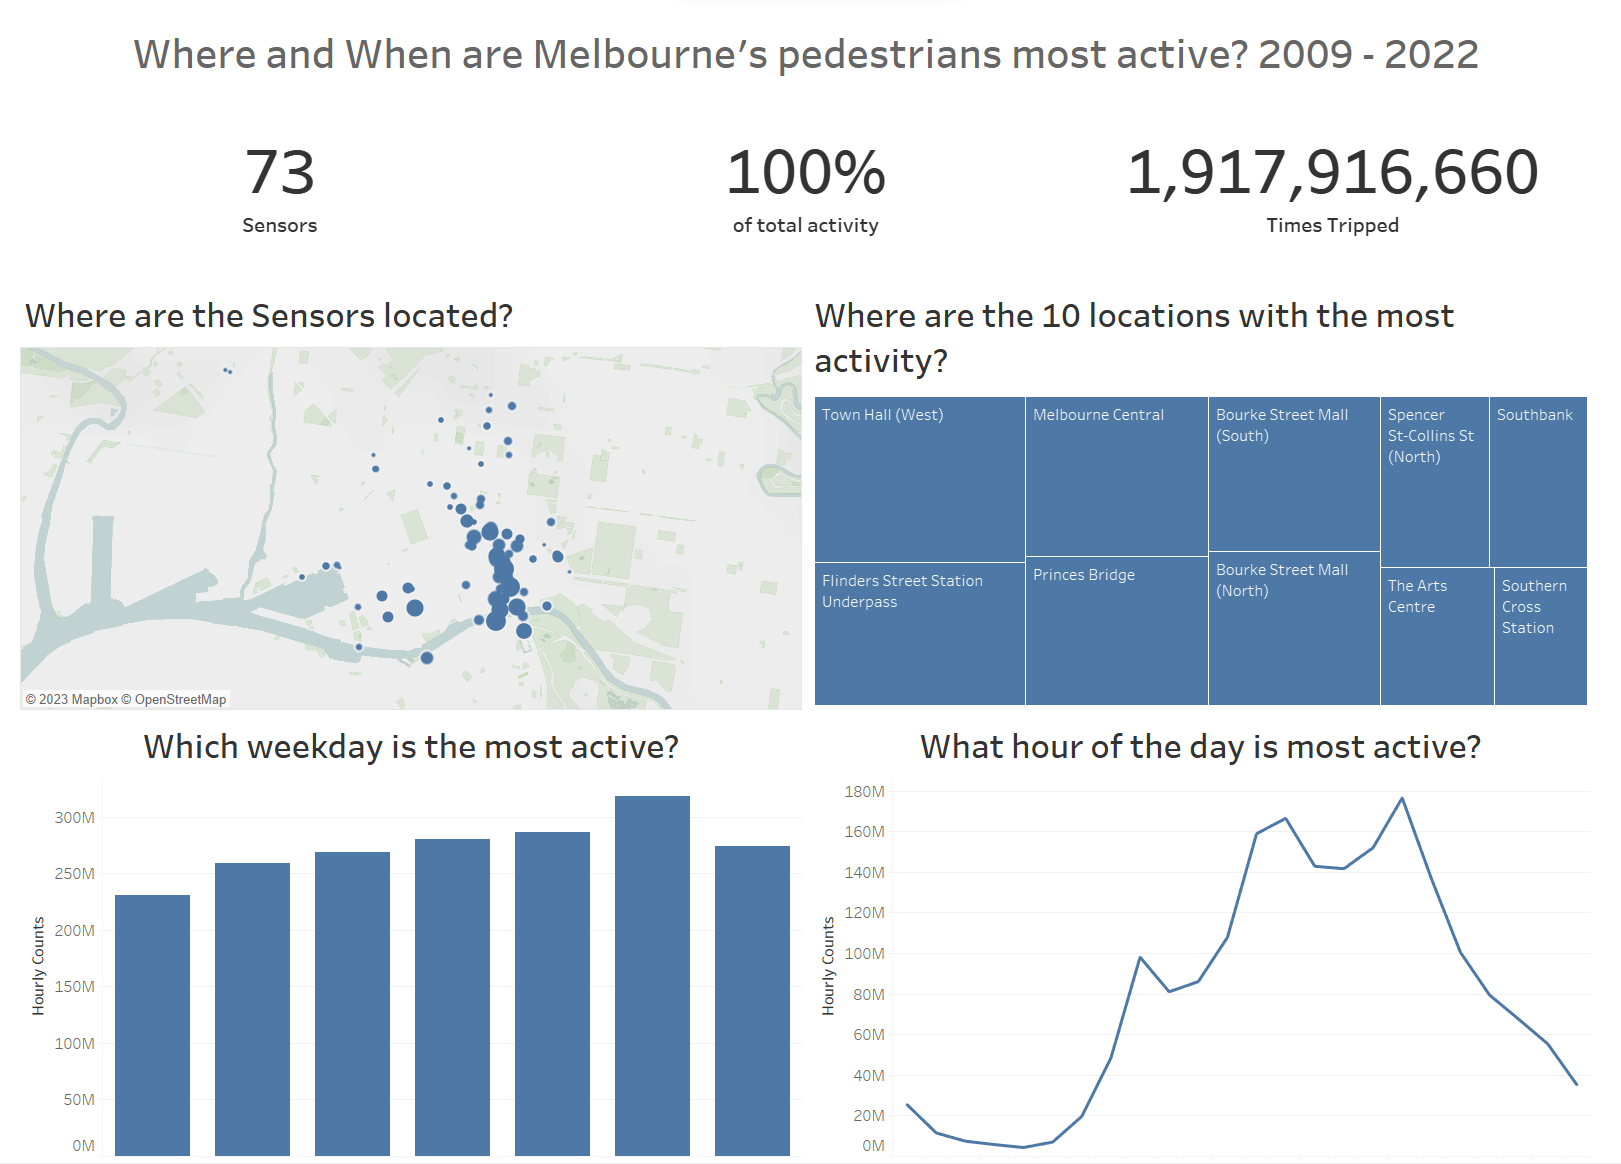
I used an LOD to make the calculated field required to see the percent of total activity when filtering down to a specific location.
Level of Detail expressions (also known as LOD expressions) allow you to compute values at the data source level and the visualization level.
Or in a simpler way for our purposes right now LODs are at an earlier point in the order of operations of things in Tableau.
The fixed portion of this calculated field calculates before the filter from the selection of the location does so it solves our problem!