Survey data can be really difficult to work with and require a ton of cleaning if good Survey practices aren't kept.
From my experience working with survey data during a client project the most important thing seems to be reducing free input. That way you can group people together and find useful insights.
Okay so your working with survey data what format do you need it to be in?
Each row in this example is a question (or question part), the answer to the question, other information about the question and then some demographic data.
There are some pros and cons to this format:
Pro: Easier to show similar questions together without the need for tons of calculations (A member of my cohort did around 40 for our last client project
Cons: Data is in same column so can't use filter actions (parameters will work).
Explodes the data.
Now that all of the data is in the same column we can group the different questions into different sections and different sheets on Tableau. How do we filter them now?

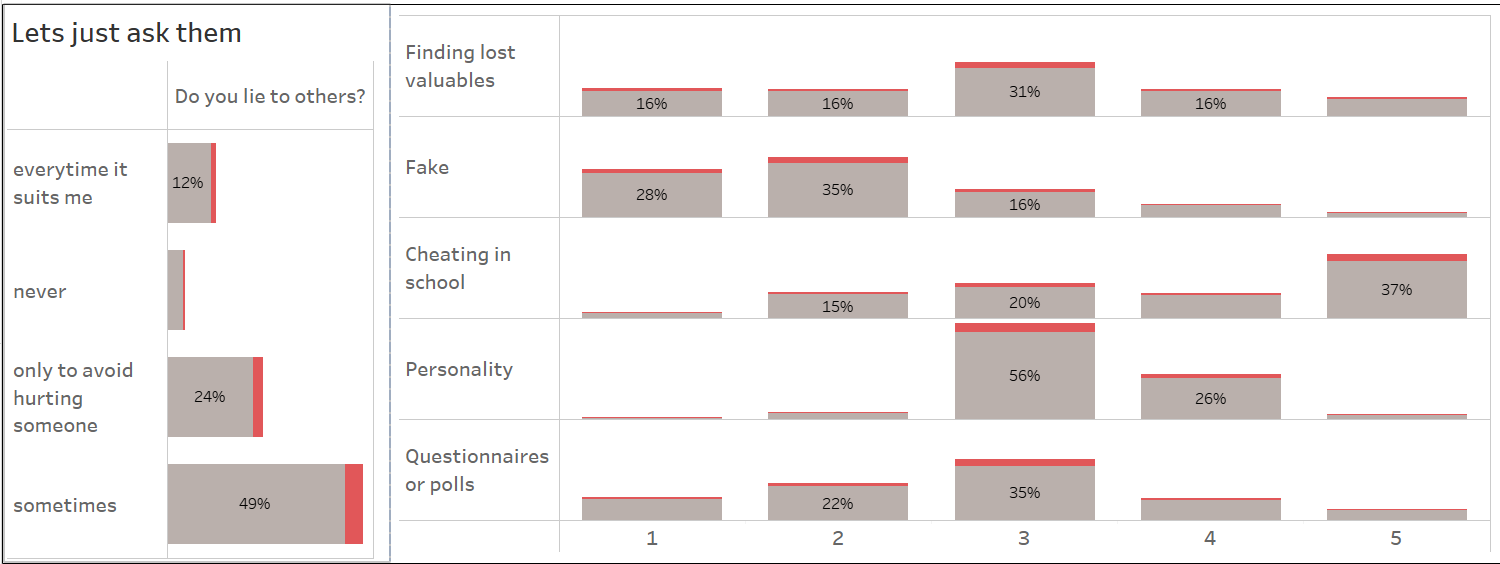
In this screenshot from my dashboard week viz I wanted to be able to see how people that said they lie every time it suits them answered the 5 questions to the right.
However these questions are in the same column so a regular filter action won't work.

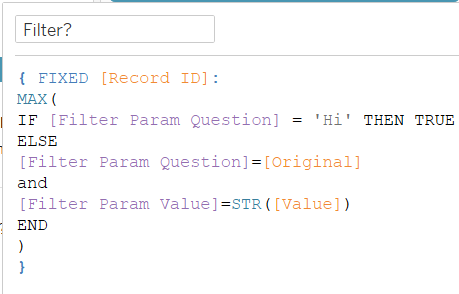
This calculation takes every record ID which is the ID for each person.
has an option for rest.
Checks if the question has been answered by that person
and
Checks if they responded with the value.
This will return a true for every record Id that has answered a specific question with a specific value. Which lets me show different questions filtered by the response to other questions even if they are in the same column.
