


Day 3's topic is APIs. Originally we were assigned Breaking Bad but turns out that api isn't working atm and is a very sketchy site atm...
So we moved onto Rick & Morty!
Link: https://rickandmortyapi.com/
So I went straight into Alteryx.
This is the output from putting in the original link so I put it straight back into a download tool to get information related to the 3 subjects.

Each has data related to the info of that section as a whole. Here is what it looks like after some formatting.
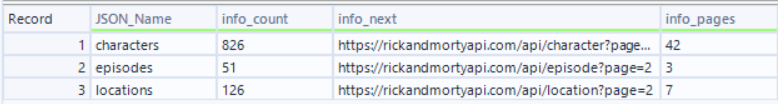
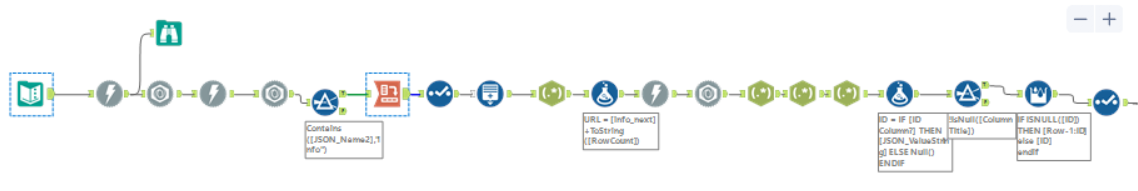
This gives me the number of pages and the structure of the url I will need for each page. So I used the generate rows tool to accomplish that.
With the links generated back through the download tool once more. Some formatting and then it can be split back into the 3 separate groups.
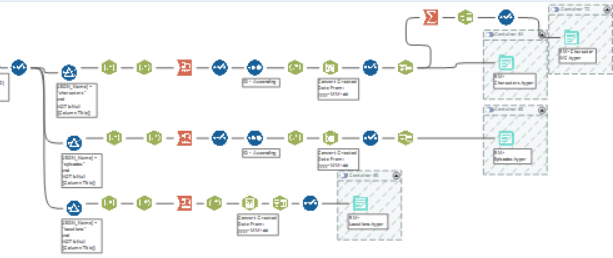
The end for each section is some simple formatting and pivoting.
With an extra portion for the character section for a potential word cloud.
Data Prep is done now to come up with an idea.
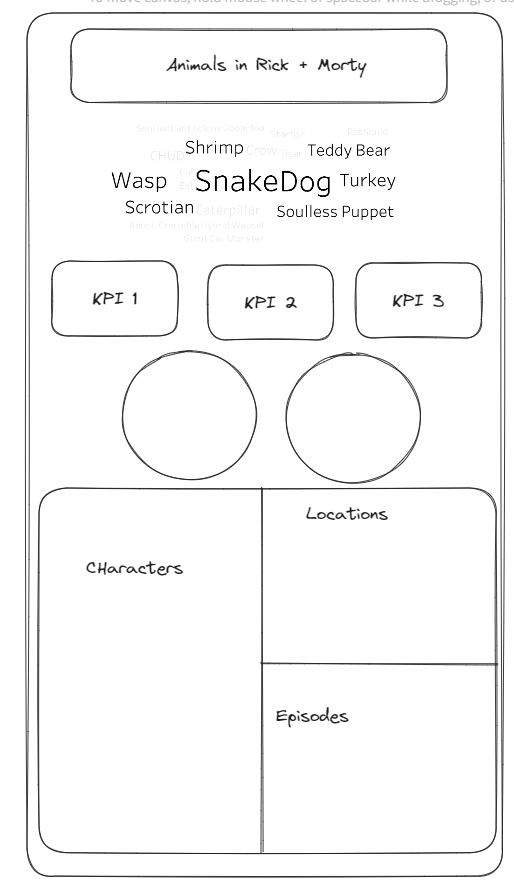
There are so many things done already with Rick and Morty data and I wanted something that would maybe be unique so I picked the animals in the universe.
Here is my wireframe for dashboard planning.
Here is the link to my final dashboard. https://public.tableau.com/views/RickMorty/Dashboard1?:language=en-US&publish=yes&:display_count=n&:origin=viz_share_link