Dashboard week day 2 for DSNY4 is Survey Data...
There was definitely a groan from all of us after seeing the topic but the data was actually pretty clean.
Data: https://www.kaggle.com/datasets/miroslavsabo/young-people-survey/
There are questions related to Music, Movies, Hobbies & Interests, Phobias, Health Habits, Personality Traits, Views on Life, & Opinions, Spending Habits, and
Demographics.
Having worked on survey data in the most recent client project I went straight into Alteryx to change the formatting of the data.
Original data:

Goal is to transform the data into something more like the slide below from the day we were trained on working with survey data.
This Alteryx flow accomplishes that.

I added some record ids so I can transpose the data and have a question and response for every row. Joined to the unshortened version of the questions for more context. Separated the demographic data and cross tabbed it. Summarized the different questions and gave each an Id. Then I joined everything back together. Used Regex to distinguish between the Text Response and 1-5 likert scale questions did some cleaning and I was done.

Record 4 here stood out to me and would be the catalyst for the direction I take today.
They responded that they were an only child and that they have 1 sibling. Which is contradictory.
My goal from this point was to find other contradictory pairs of questions in the data and then find questions related to ethics and see how things line up.
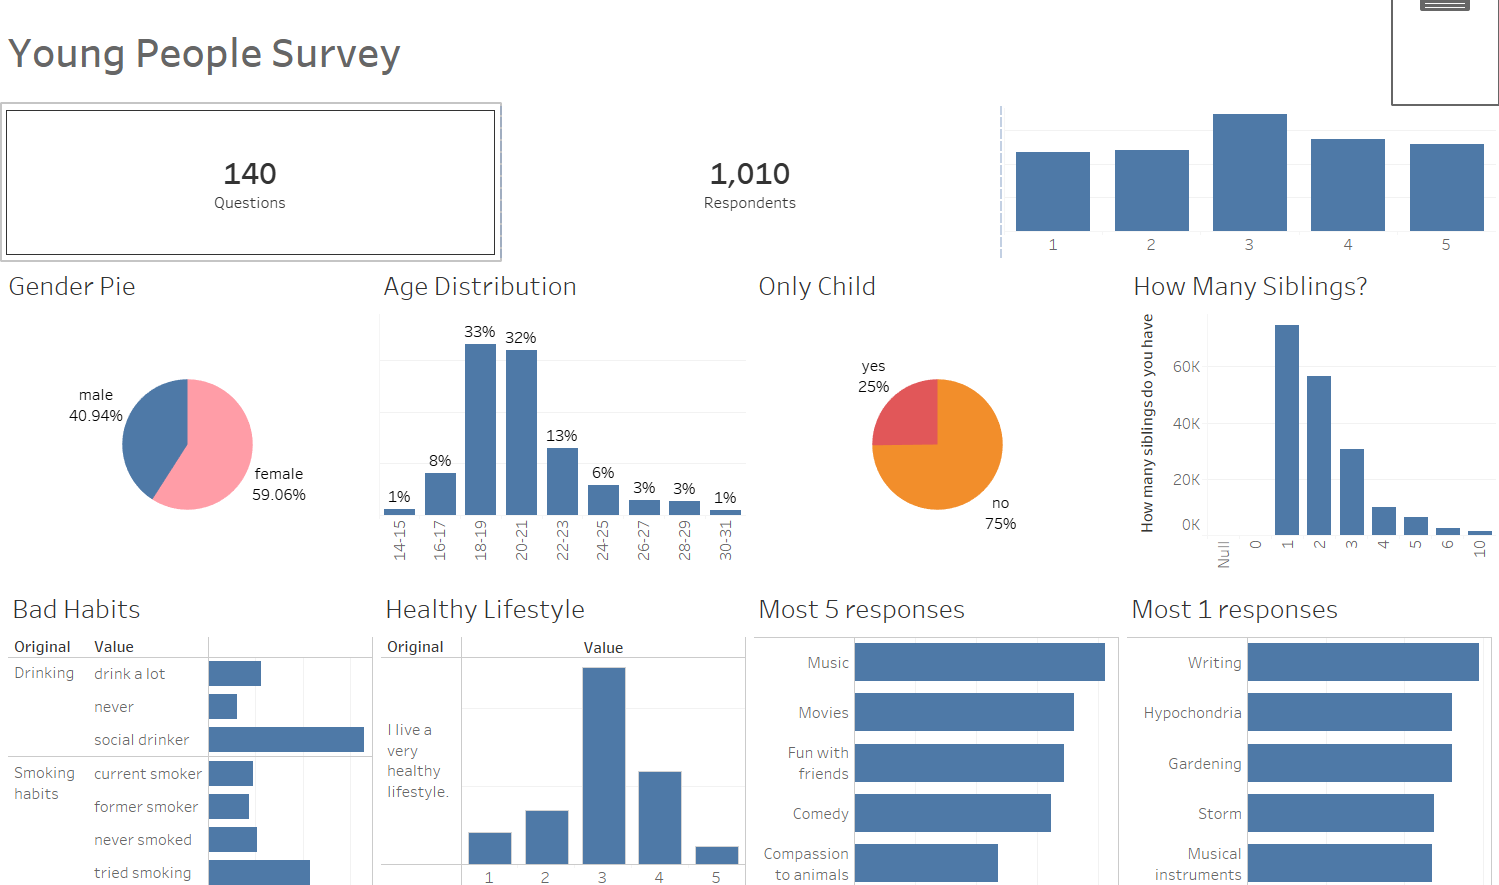
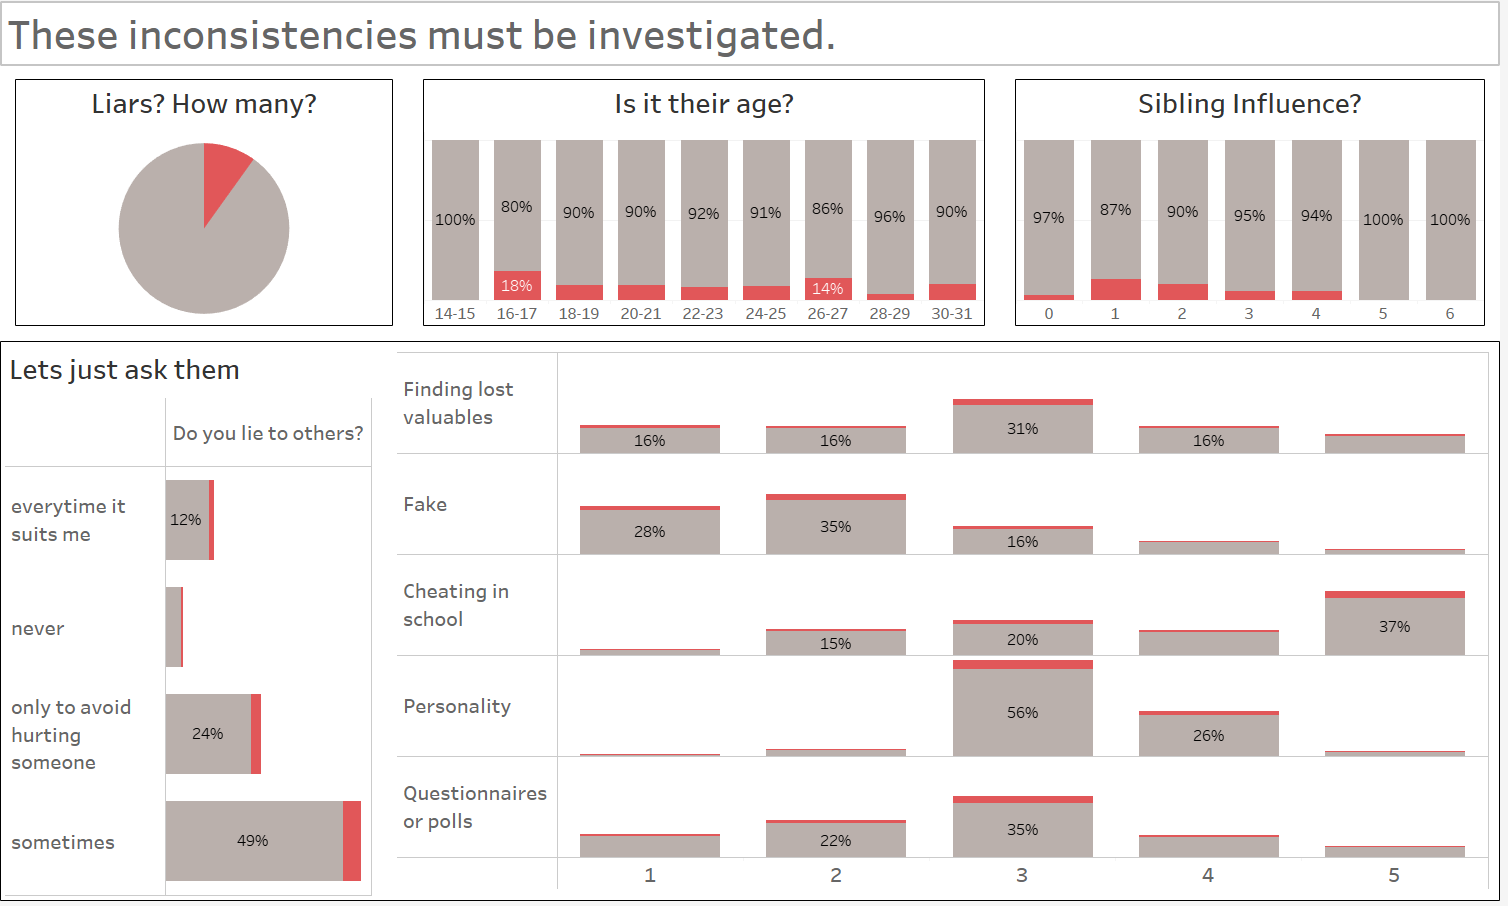
Here is the resulting dashboard with an extra decoy dashboard to add some extra context. After filtering to the people that claim they are an only child but have siblings and the people that claim to live a healthy lifestyle but drink or smoke often a navigation button appears to the second dashboard.


