Chapter One: Learning Process
After being introduced to Data School during the Meet and Greet in September, I realized that I wasn't ready for DSDE 6, so I planned for the next cohort. I enrolled in a 4.5-month online bootcamp. However, after a few days, I realized that the course wasn't sufficient to prepare me for the position. Consequently, I began self-learning Data Analytics concepts, Tableau skills, Data Storytelling, and other relevant topics through various platforms.
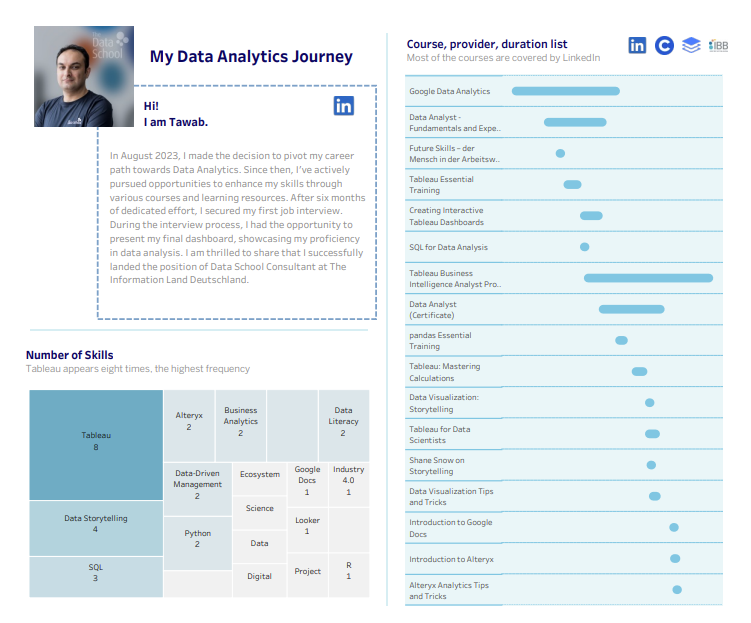
I recommend the following resources for learning Data Analytics and Tableau:
- Google Data Analytics course: Provides a solid foundation in core concepts of data analytics.
- Tableau Data Analytics course: Specifically focuses on mastering Tableau for data analysis and visualization.
- Heidi Kalbe's LinkedIn Course on Table Calculations in Tableau: Offers in-depth guidance on mastering Tableau's powerful table calculations.
- Andy Kriebel's YouTube Tutorials: Provides valuable tips and tricks for maximizing efficiency and effectiveness in Tableau usage.
Chapter Two: The Data School Application Process
The position's application deadline was January 15, 2024, and I received my acceptance call in the last week of February. The entire application process, from preparing my first dashboard to receiving the final positive call from The Information Lab, lasted around two months.
- Stage one: Initial Dashboard
It was challenging for me to find a suitable and clean dataset to visualize. After extensive searching on various websites, I finally discovered a police death database on Kaggle and began creating my dashboard, initiating the application process.
A week later, I received detailed feedback via email, highlighting 15 points for improvement on my dashboard. Implementing all the feedback on my current dashboard proved to be difficult, so I made the decision to create a new dashboard and attempted to address all the feedback points.
I was thoroughly prepared with my dashboard and focused on crafting a compelling narrative to convey during the phone screening application interview. My main concern throughout the interview was my proficiency in German language. However, I found the interview process to be friendly and welcoming. Despite my language apprehensions, I was able to confidently present myself and my dashboard during the interview.
- Stage Two: Final Dashboard
After one week from the initial interview, I received a dataset to be visualized and presented within 10 days. On the first day, I dedicated time to understand the data and define the story I wanted to visualize. The second phase involved data cleaning, which was an ongoing process before and during visualization and consumed the majority of my time.
I managed to craft my story into a dashboard within three days. Unfortunately, I missed out on three days and a one-hour feedback session with TIL consulting due to sickness. In the final two days, I focused on polishing tooltips, colors, text sizes, and published my finalized dashboard.
On the day of the interview, I arrived 15 minutes early and engaged in small talk with the consultants. The interview began, and I was given a 5-minute opportunity to present my dashboard. All four people on the panel were friendly, and I received positive feedback as well as constructive suggestions for improvement regarding my dashboard.
Only 10 minutes of the interview focused on technical aspects, while the remainder centered on soft skills in both German and English. At the conclusion of the interview, I was informed that I would receive a call within 7 to 10 days. As the interview wrapped up, I wondered how I would wait for the next week to hear back from TIL
Three days later, I received a call from Lena informing me that I could join the Data School for the next cohort. It was the best news I had received in the last 2.5 years.
End of Part 2!