Step 1: Create a duplicate of your date field. To prepare it for parameters, extract the exact month and year using the following syntax:
DATE(DATETRUNC('month', [Order Date]))
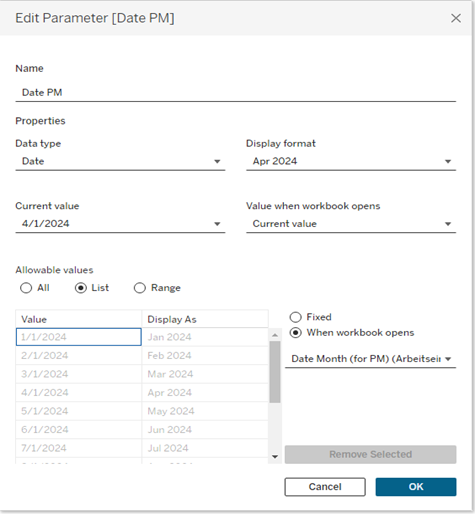
Step 2: Create a Date Parameter
For this parameter, use "Date" as the data type and set the display formatting to the format that you want to pass to your visualization and filter. In this example, I have used the mmm yyyy format. Use "From List" and make sure to choose your date field from the "When workbook opens" option. Finally, show your parameter.
Step 3: Use a Calculated Field to Extract the Current Month Values from the Date
IF DATETRUNC("month",[Order Date])=[DatePM] THEN [Sales]
END
Step 4: Use a Second Calculated Field to Extract the Previous Month's Values
IF DATEADD("month",-1,DATETRUNC("month",[DatePM]))
=DATETRUNC("month",[Order Date])
THEN [Sales]
END
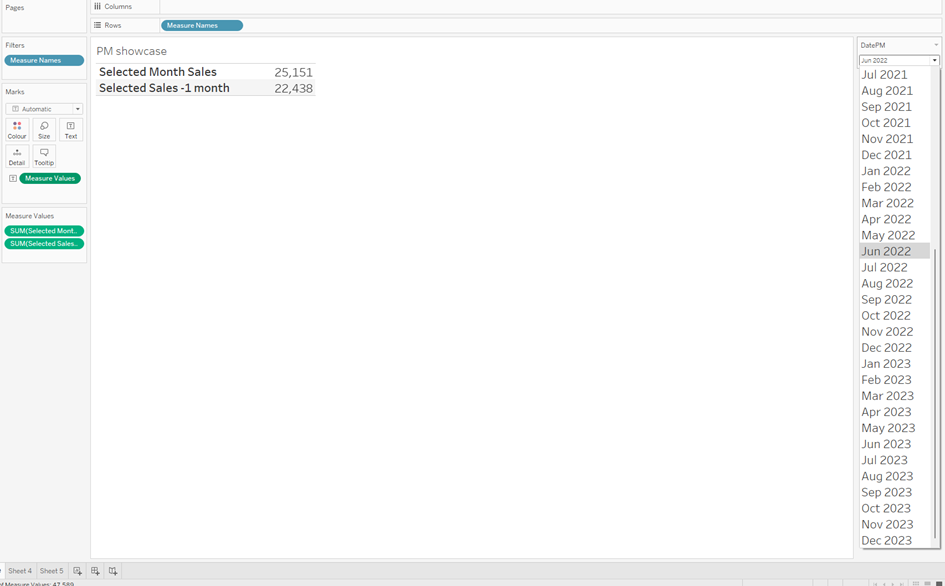
Step 5: Add All to the View
Add all these fields to the view. You will now have a monthly comparison and can calculate the percentage change or difference in comparison to the previous month.