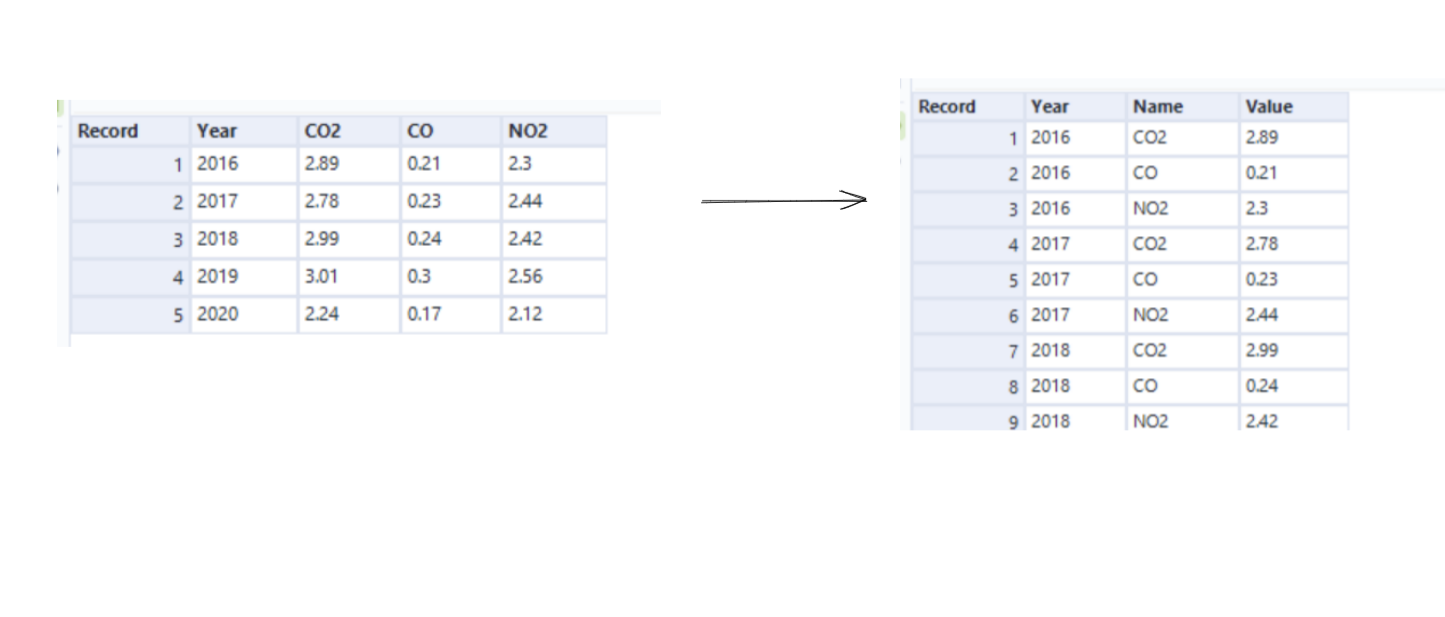
This blog will be focusing on the difference between Cross Tab and Transpose tool and to look at the practical applications in where and when these tools should be used. Cross Tab and Transpose are considered opposites.
Cross tab -

The Cross Tab tool pivots the data so that a narrow data becomes a wider data set. This is shown below

This makes multiple new columns out of values contained in a single column.
This was an example we used in Alteryx:
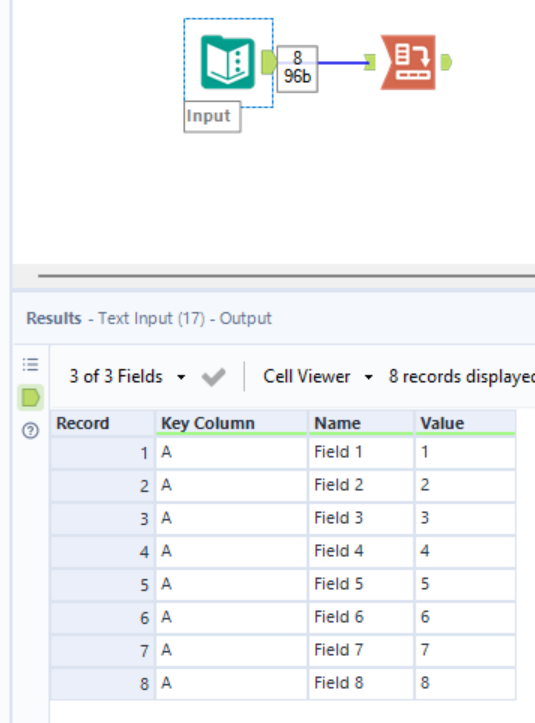
This shows you the table and how it is inputted into Alteryx. We want to change the name to columns for this challenge. The next step is to use the cross-tab tool. The cross-tab tool is shown below this shows what the options are to complete the pivot.
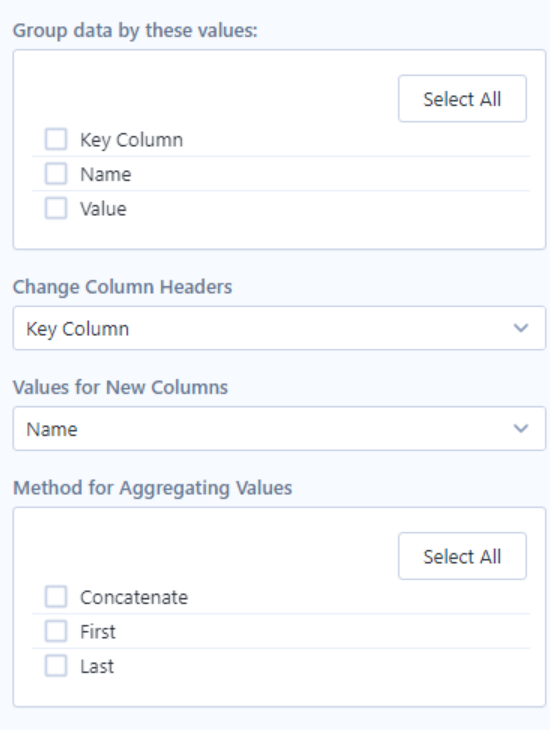
The buttons you press on the pane for this example are:
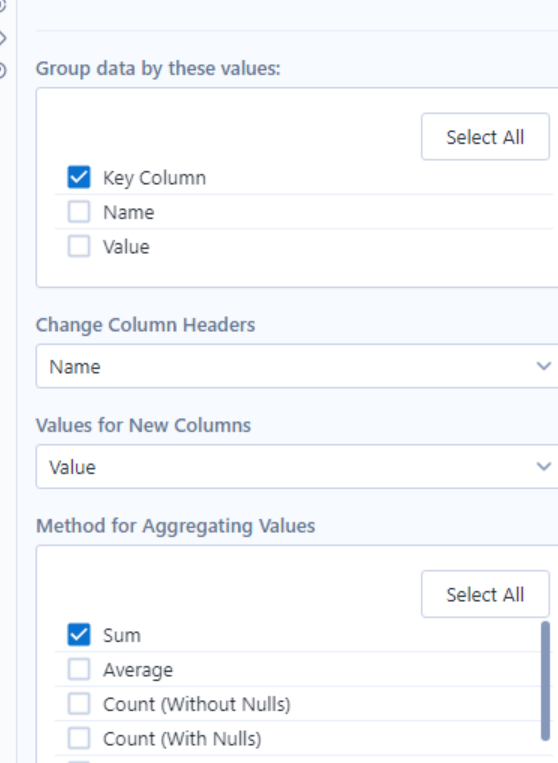
Group data by these values: This is the item/items you want to group everything when we cross-tab. For this example it was Key Column.
Change column Headers: this is the field that you want to pivot. For this example it was Name.
Values for New Column: the value you want the rows to take. For this example it is Value
Method for Aggregating Values: this is how you want your values to come out in this case we want a sum.

Transpose-

The Transpose tool pivots the data so that the wide data set becomes a narrower data set. This is shown below:

This was an example we used in Alteryx:
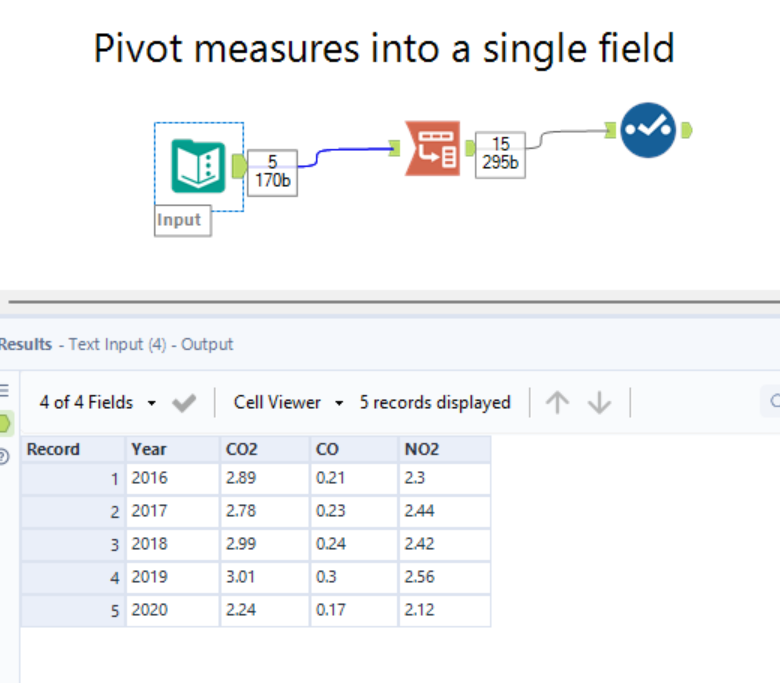
This shows you the table and how it is inputted into Alteryx. The task is asking us to change the measure into a single column. The measure in this instance is CO2, CO and NO2. The next step is to use the transpose tool. The transpose tool is shown below this shows what the options are to complete the pivot.

The buttons you press on the pane for this example are:
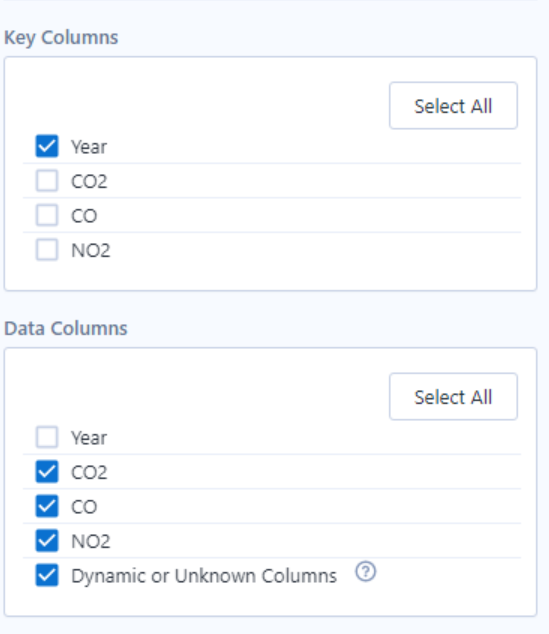
Key column: This is the item/items you don't want to change or be affected by the pivot. So for this example Year.
Data Columns: This is the item/ items you want to change into a single column for this example we would use CO2, CO, NO2 and Dynamic or Unknown Columns. (Dynamic or Unknown Columns are selected as well because running a workflow can introduce new columns that were unknown at configuration time. Select this option to include dynamic or new columns.)
When you run this you can see that the data has become more narrow. Below shows a picture that shows the input to what the table looks like after using the cross-tab tool.
