This was a new update on tableau which allows you to switch between sheets on a dashboard.
For this I will just be showing a simple example between a bar chart and a map and how we can swap between the two.
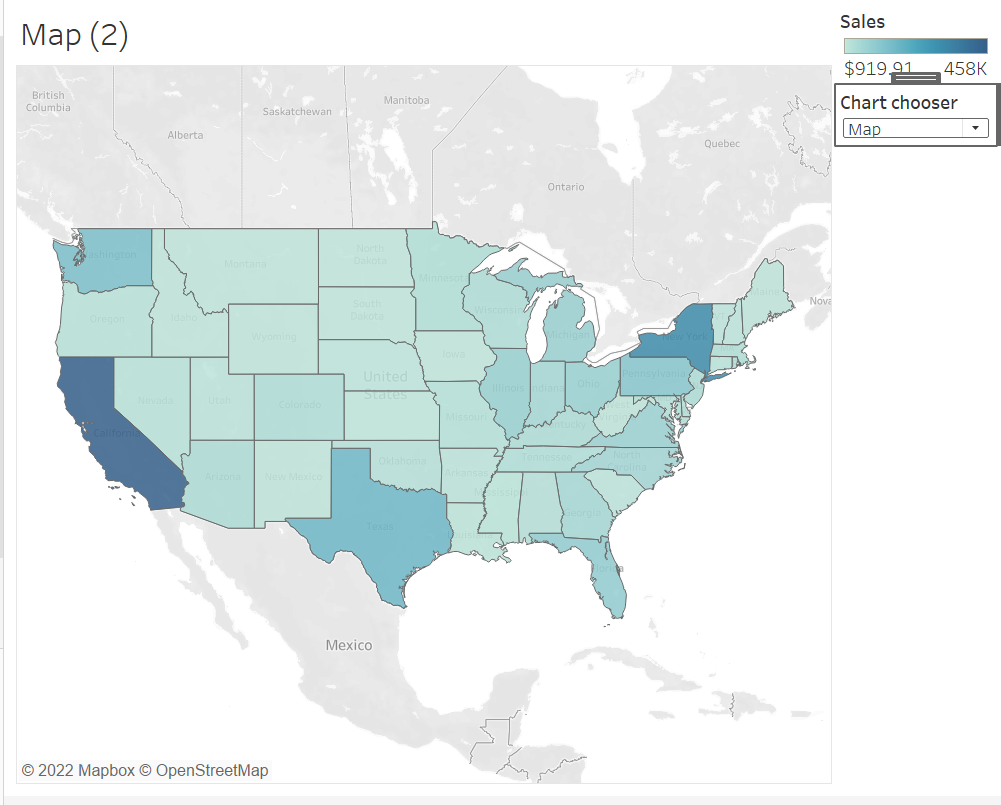
So first lets create a map.
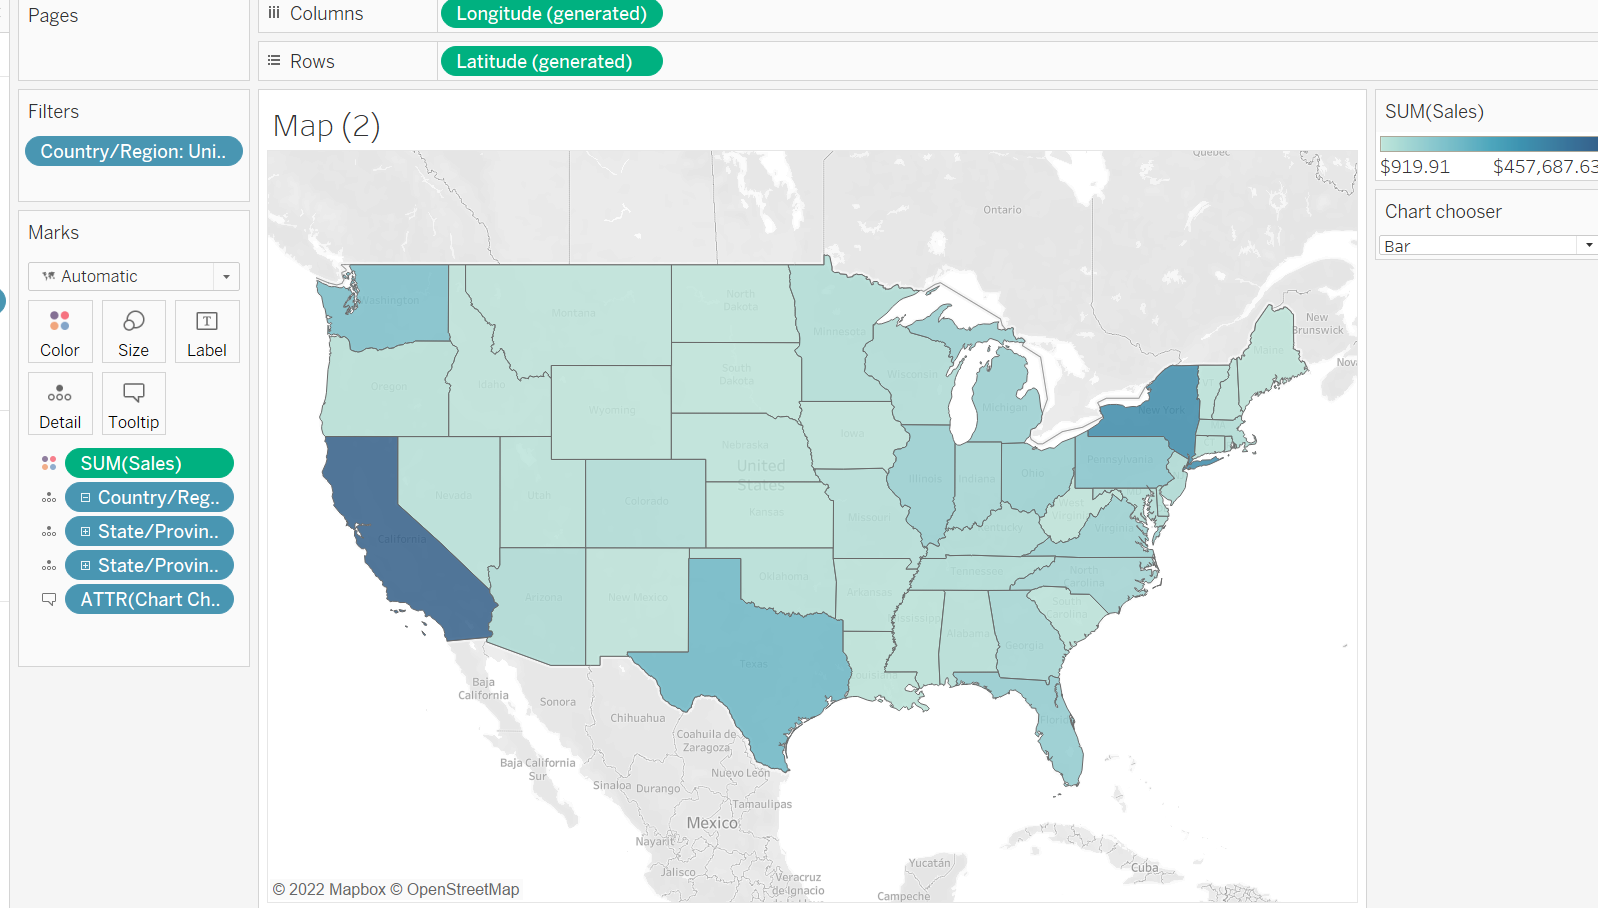
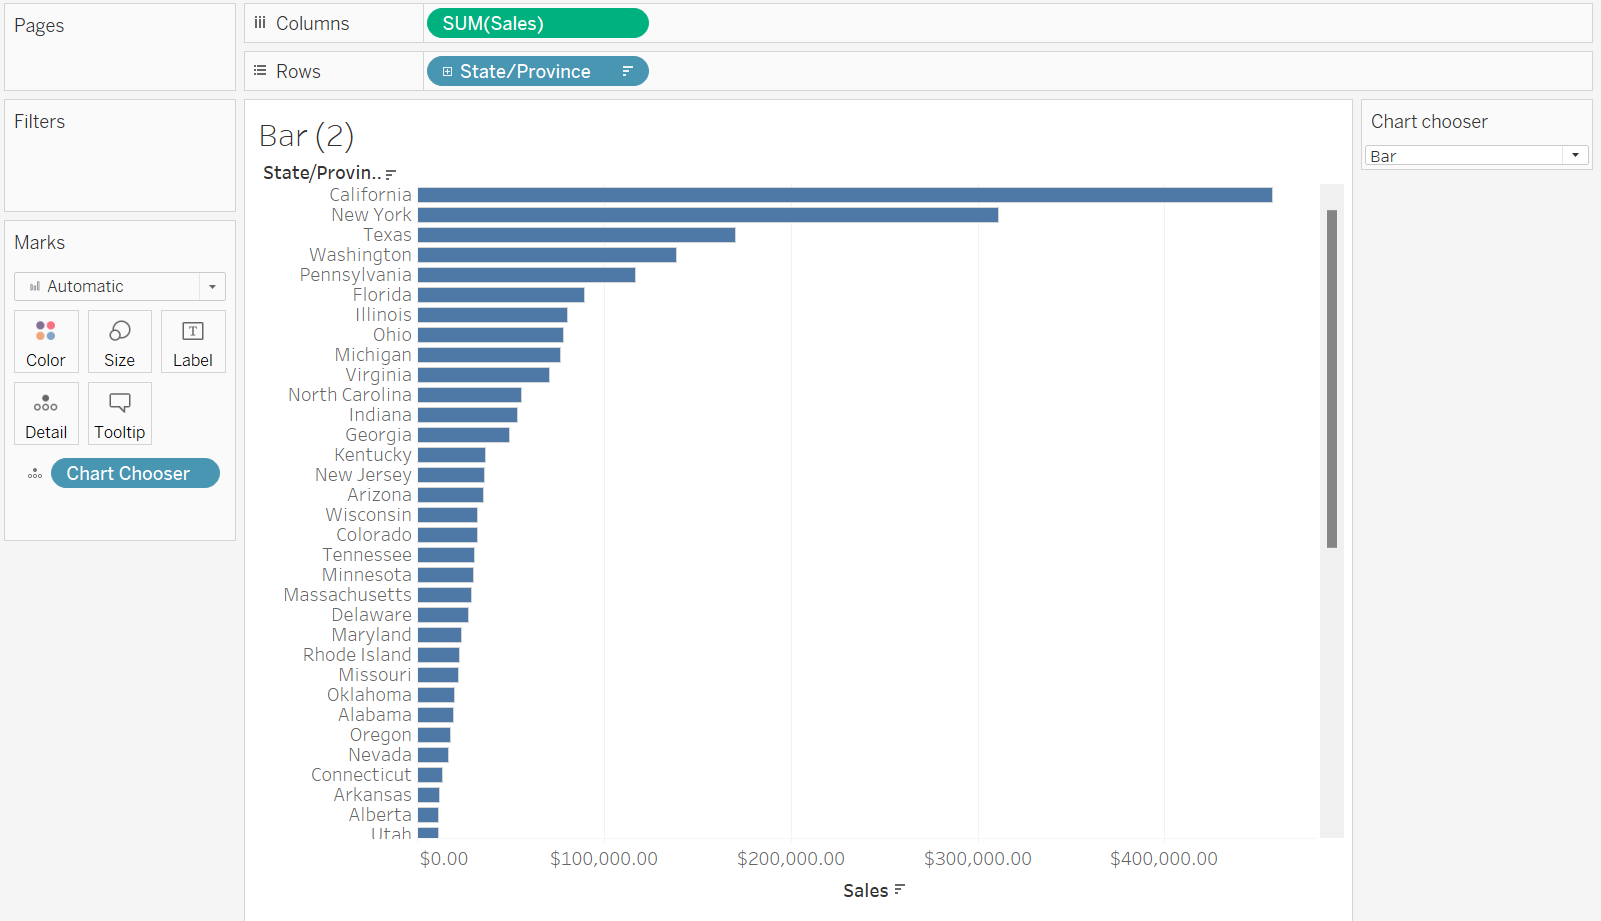
Now lets create a bar chart.
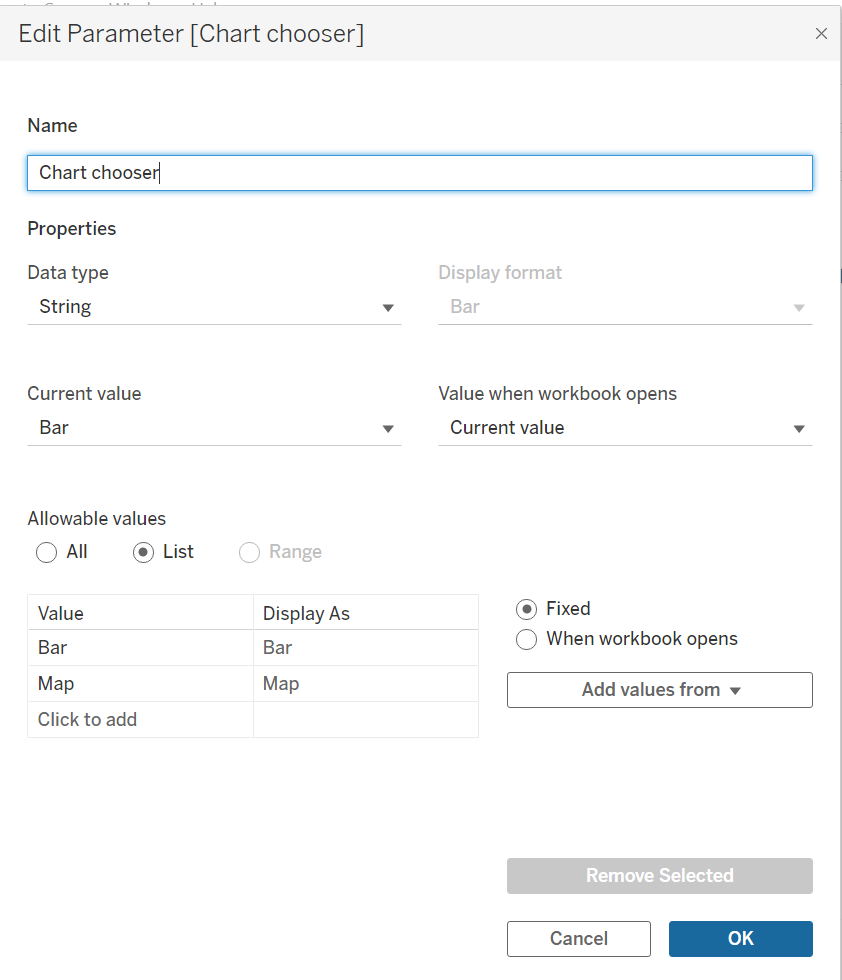
Now we have the graphs we can add a parameter. [ You can add as many graphs to this as you like just remember to create a Boolean calculation for each]. Remember how you spell everything in a parameter otherwise further calculation will not work.
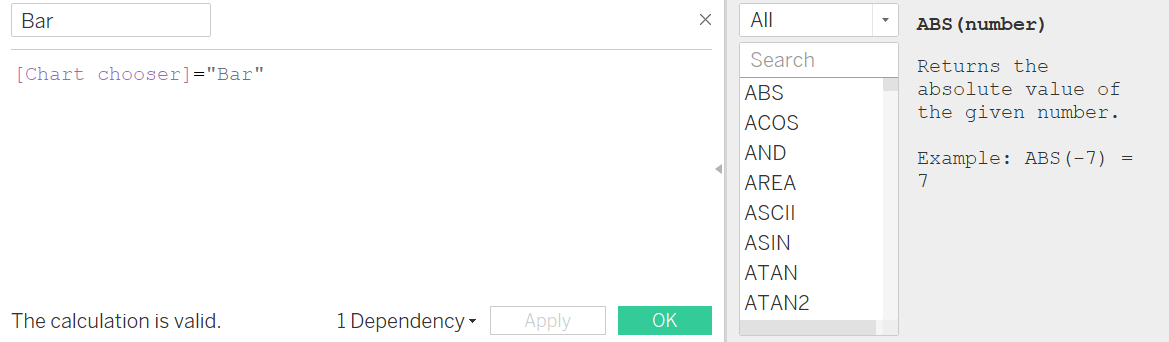
Now to allow the action to happen we need to create a Boolean calculation. This means there is only two answers such as true and false. Lets start with map.
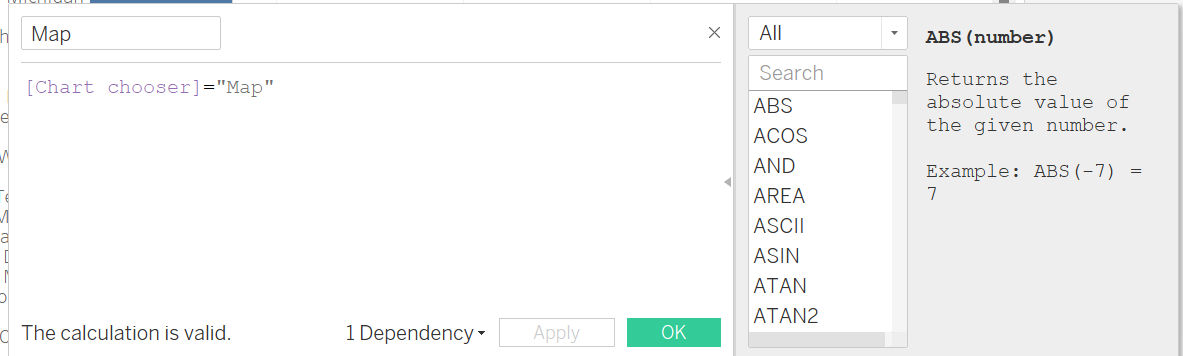
I then duplicated this and changed the title to Bar and also the chart chooser to bar.
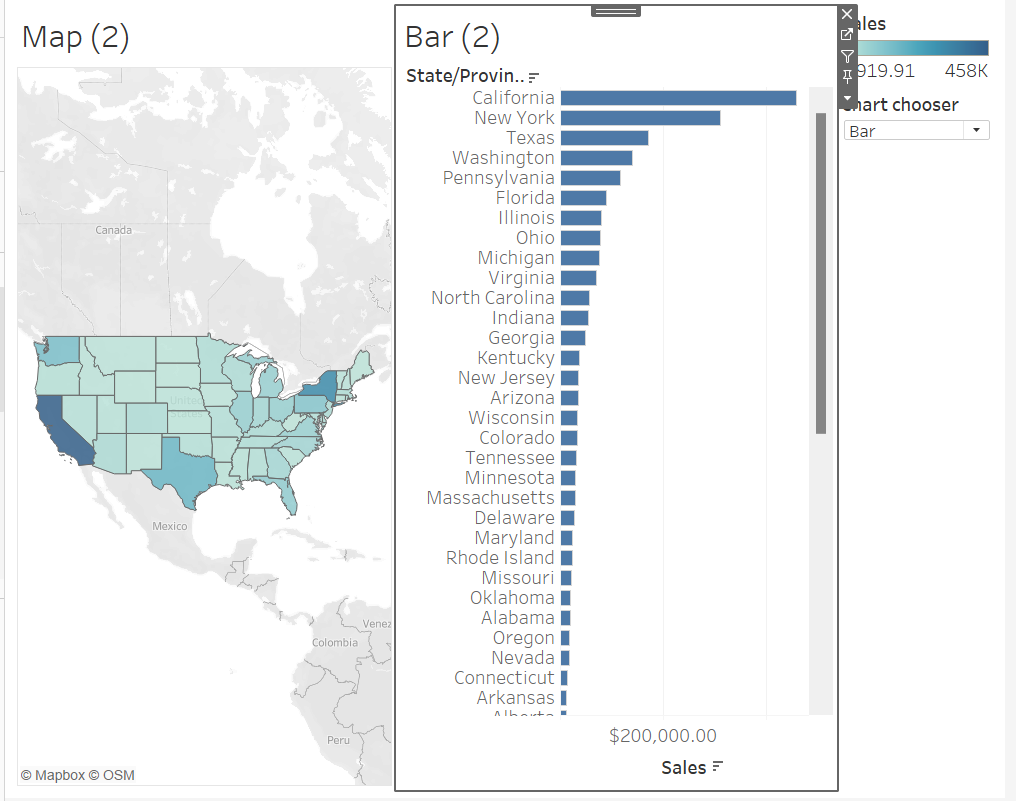
Next step is to create a dashboard.
First lets add a horizontal container. Now drop both graphs in like so:
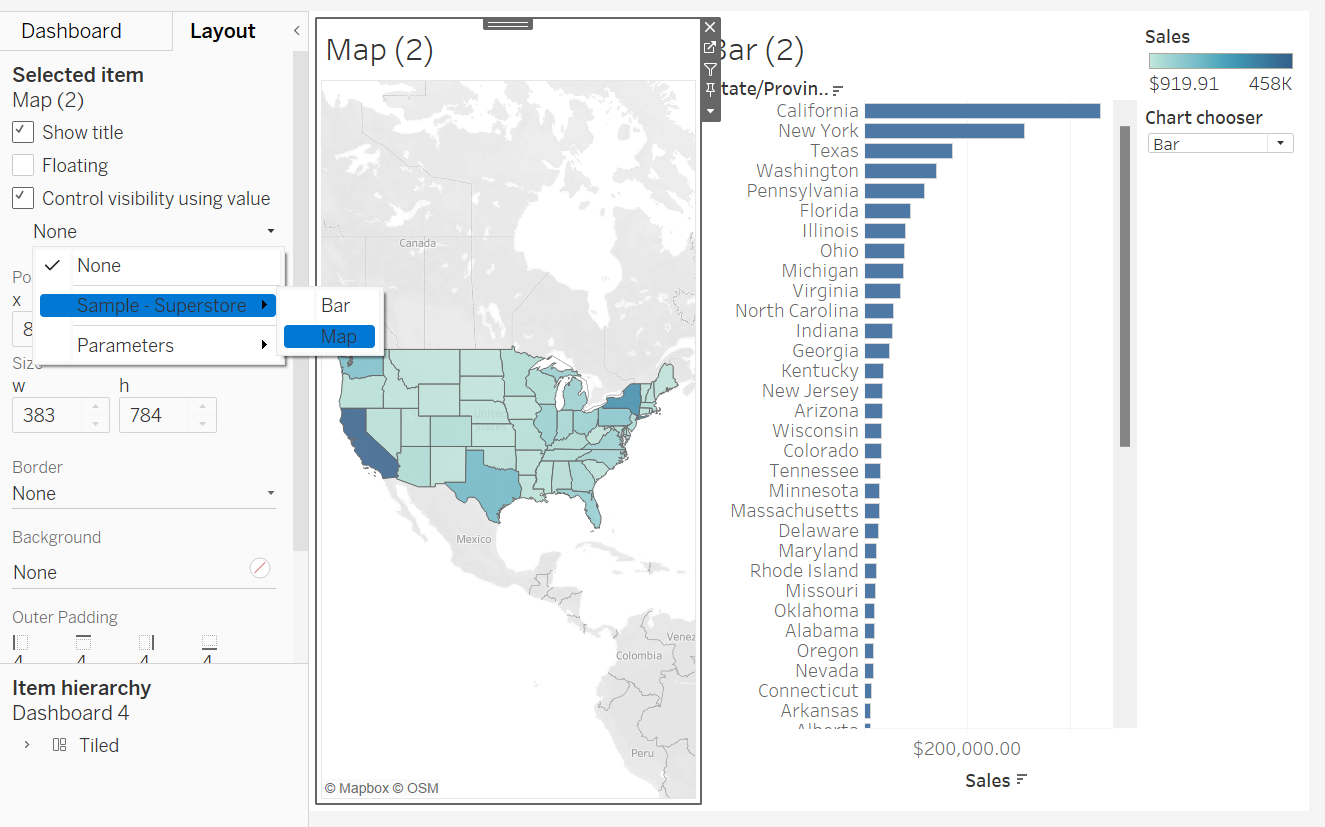
Click on map and now go to layout and press control visibility using value and press map. Do the same for Bar.
You will get the following:
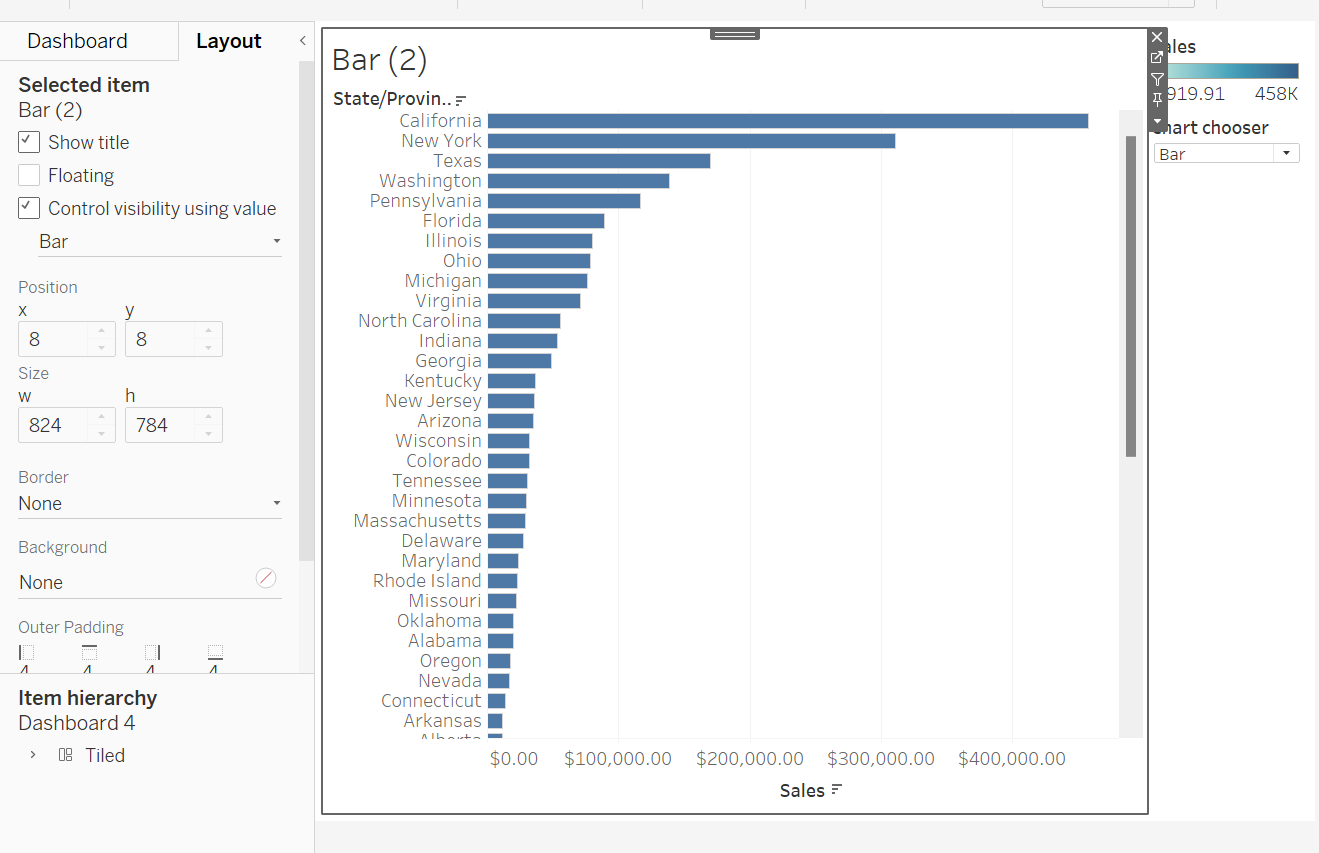
Now using chart chooser you can swap between the two. So when I change the chart chooser to map the dashboard changes to the map graph as shown below.