


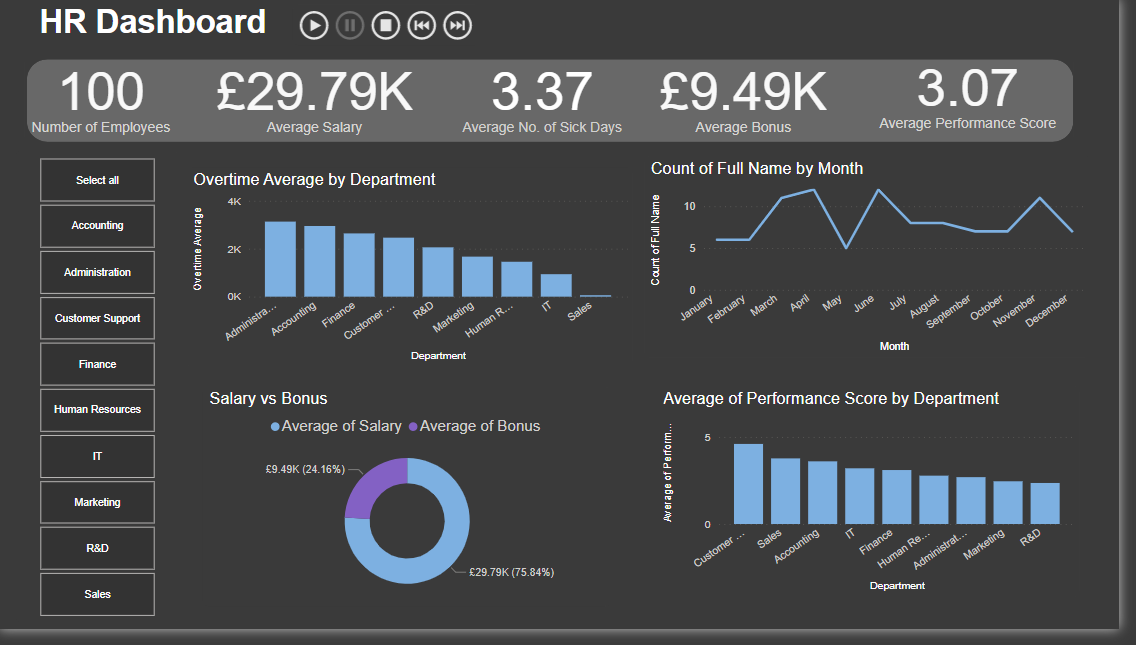
For todays task we had to create a dashboard on Power BI. This will be a challenge as we have had very little training in PBI. We had to pick one of the following mock data sets for 4 different industries: Customer Service, HR, IT Help Desk, SEO Analytics. For mine I chose to do HR.
First of all I looked through the data to see what can be done. I Also viewed other HR dashboards for inspiration for what graphs/ contextual numbers they used.
For data prep this was not really needed. For myself I tried to keep the dashboard as simple as possible as well as trying to apply some of the features we learnt within accessibility.
This was very challenging and I had to YouTube some of the power BI features. I did want to try add more calculations but am still unsure how to do this. I started to get a hang of Power BI and with more time and practice I believe I could improve and add more features.
What I enjoyed:
- There was additional features which made making accessibility a lot easier.
- Its very easy to make graphs on the dashboard rather than having separate sheets like tableau.
- The chart chooser section is quite useful and can produce more complex charts a lot easier and quickly than you could do with Tableau
- You don't have add filters to everything it automatically does it.
- The Q and A is really useful to give you ideas for graphs.
What I Disliked:
- There are certain things that are quite niche that you are unable to do easily such as for example having two fields on colour or trying to get a max count for a particular month as a KPI.
- Making 'Calculated Fields' or new columns was a lot harder and I could not do this very well. I could not work out the equivalent to a LOD even when following YouTube videos.
- Uploading to the public gallery was very difficult. ( There is another blog especially how to do this
What to improve on based on feedback:
- Give time to practice presentation and to write blog.
- Ask for help sooner.