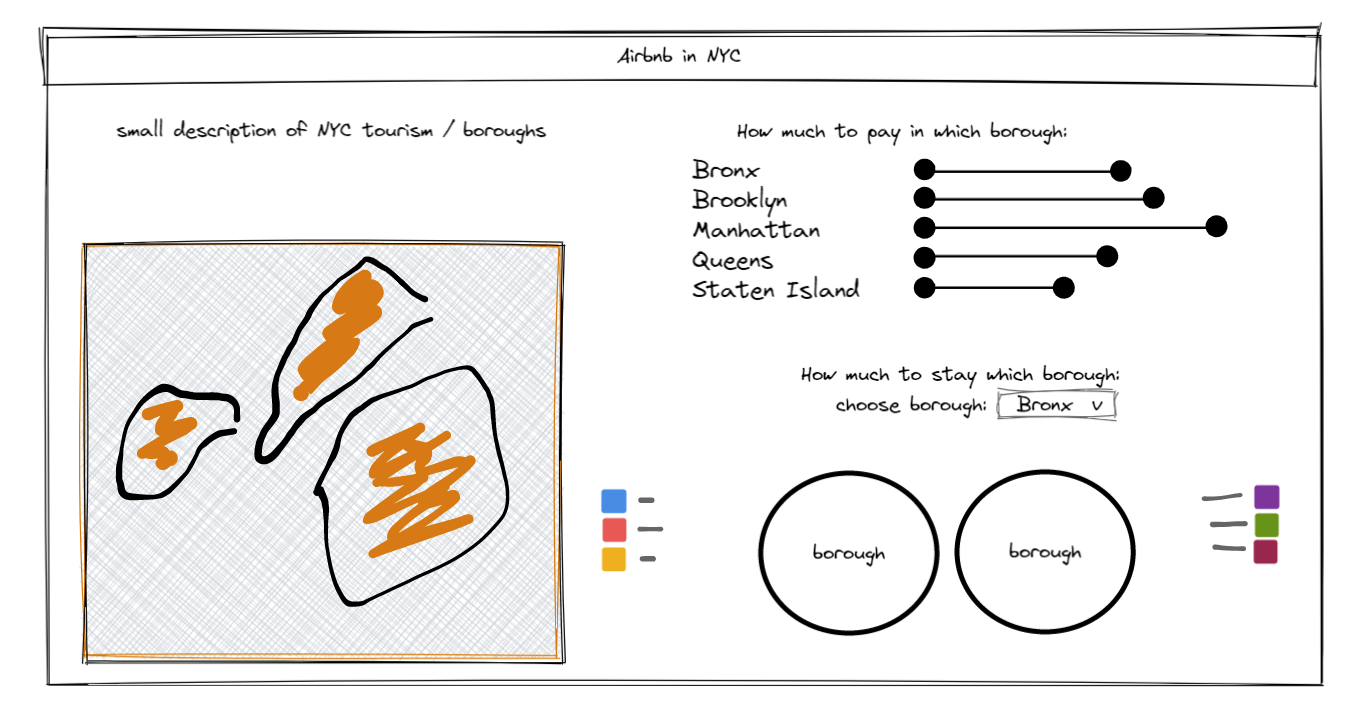
Looking at a new blank Tableau page you can feel overwhelmed by the options you are given to visualize your data. Especially in the beginning when you learn all about those different charts, you might want to show off your new skills and put as many different visualizations on your dashboard as possible (hint: don’t). Instead start thinking about the question you want to answer with your data. A good way to not lose focus of it is to make this question the title of your dashboard – maybe just as a working title but you might as well end up keeping it. Then only keep those visualizations that bring you closer to answering that question.
The next thing to think about is how to organize the dashboard. You don’t want to over-complicate things but also don’t want to waste space. It’s really helpful to actually sketch out different options to see where the attention gets drawn to or which graphs works well together. If you’re not too much into classic pen and paper work there’s several solutions to sketch on screen. One good option is “Excalidraw” but even good old “Paint” might do the job.

One should always keep in mind though that there is no single best way to visualize your data. It’s depending on your question, the audience, your time limit and so on. And in the end there will always be at least a small part that is an individual opinion on what looks aesthetically pleasing.
