Parameters are a great feature of Tableau to help making your visualization more interactive. Here’s a simple example: A customer asks you to visualize different measurements regarding her sales team over time, let’s say profit and quantity. You could of course create two different charts or just throw them together but your customer wants to be able to choose what she’s looking at. That’s where parameters are useful.
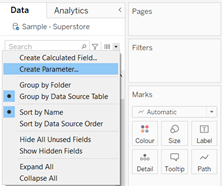
An easy way to create a parameter is to just hit the “Create Parameter” button in your data pane options.

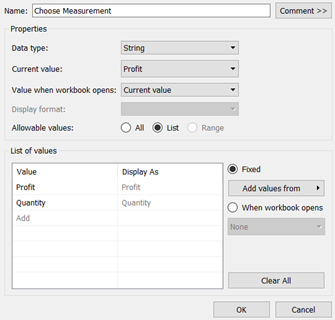
In the field that pops up you can then choose the settings for your parameter. In this case we want to be able to choose from a list of string values (=our measurements for the sales team). Watch out for typos in the list of values as Tableau will not be able to match the value with the measurement.

You can see the created parameter then in your data pane down in the parameters section and you can already show the parameter on the canvas. But it will not yet work in the way we want it to because we did not tell Tableau how to handle this request. We can do this by creating a calculated field which defines how each of our values from the parameter list.

We then drag both the created parameter and the calculated field onto our rows or column field. Additionally we drag a date field onto the other field (row/column) as the customer requested different charts over time. Depending on the choice in the displayed parameter you can see either the profit or the quantity sold.

