What are parameters?
Parameters in Tableau are versatile tools that enable dynamic interactivity in the data and provide deeper insights with only a few clicks. Parameters allow us to change values, which in turn can modify calculations, filters, and visual elements on the dashboard. Essentially, parameters serve as placeholders for a single value, such as a number, string or date, which can be used to adjust what the viewer sees. Being user-friendly and offering more flexibility to dashboards, parameters allow us to explore data in various ways without needing multiple separate charts.
How to create a parameter?
In this example, the Superstore dataset is used to create a parameter, in which the user can choose whether to see profit or sales in the view.
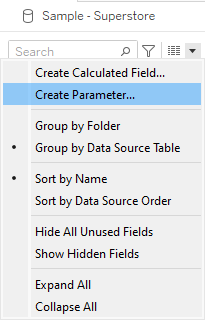
- To create a parameter, click on the dropdown arrow in the data pane and select the option to create a parameter.
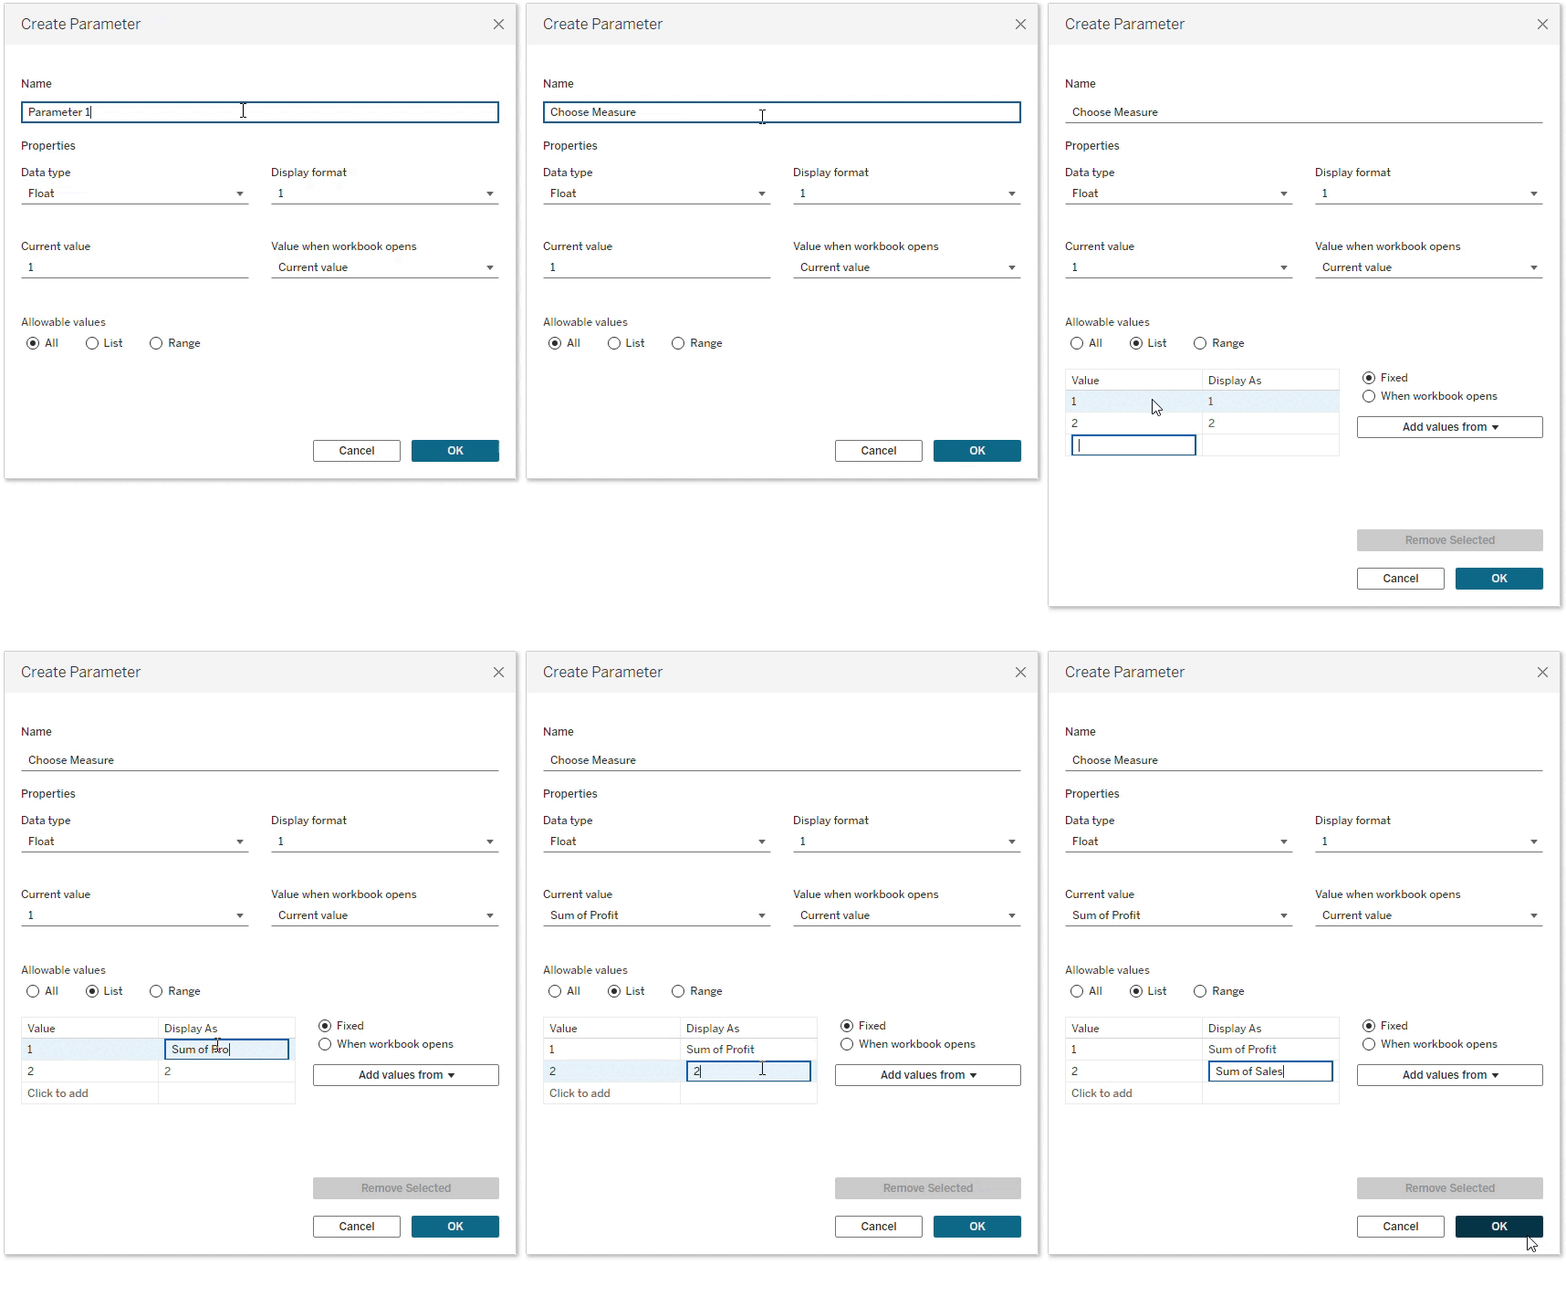
In the dialog box, give the new field a name. Under properties, the user has the option to change the data type for the accepted values, as well as specify a current value (the default value is 1).
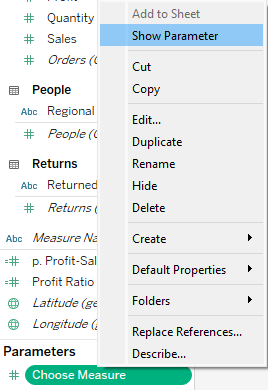
- With a right-click on the created parameter, choose the option to show parameter.

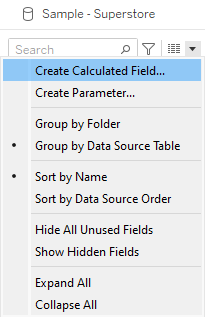
- Next: use the parameter in a calculated filed, which can be created via the dropdown menu in the data pane.
Use the CASE function to match the corresponding values in the parameter and return the required calculations, which are the sum of sales and sum of profit.
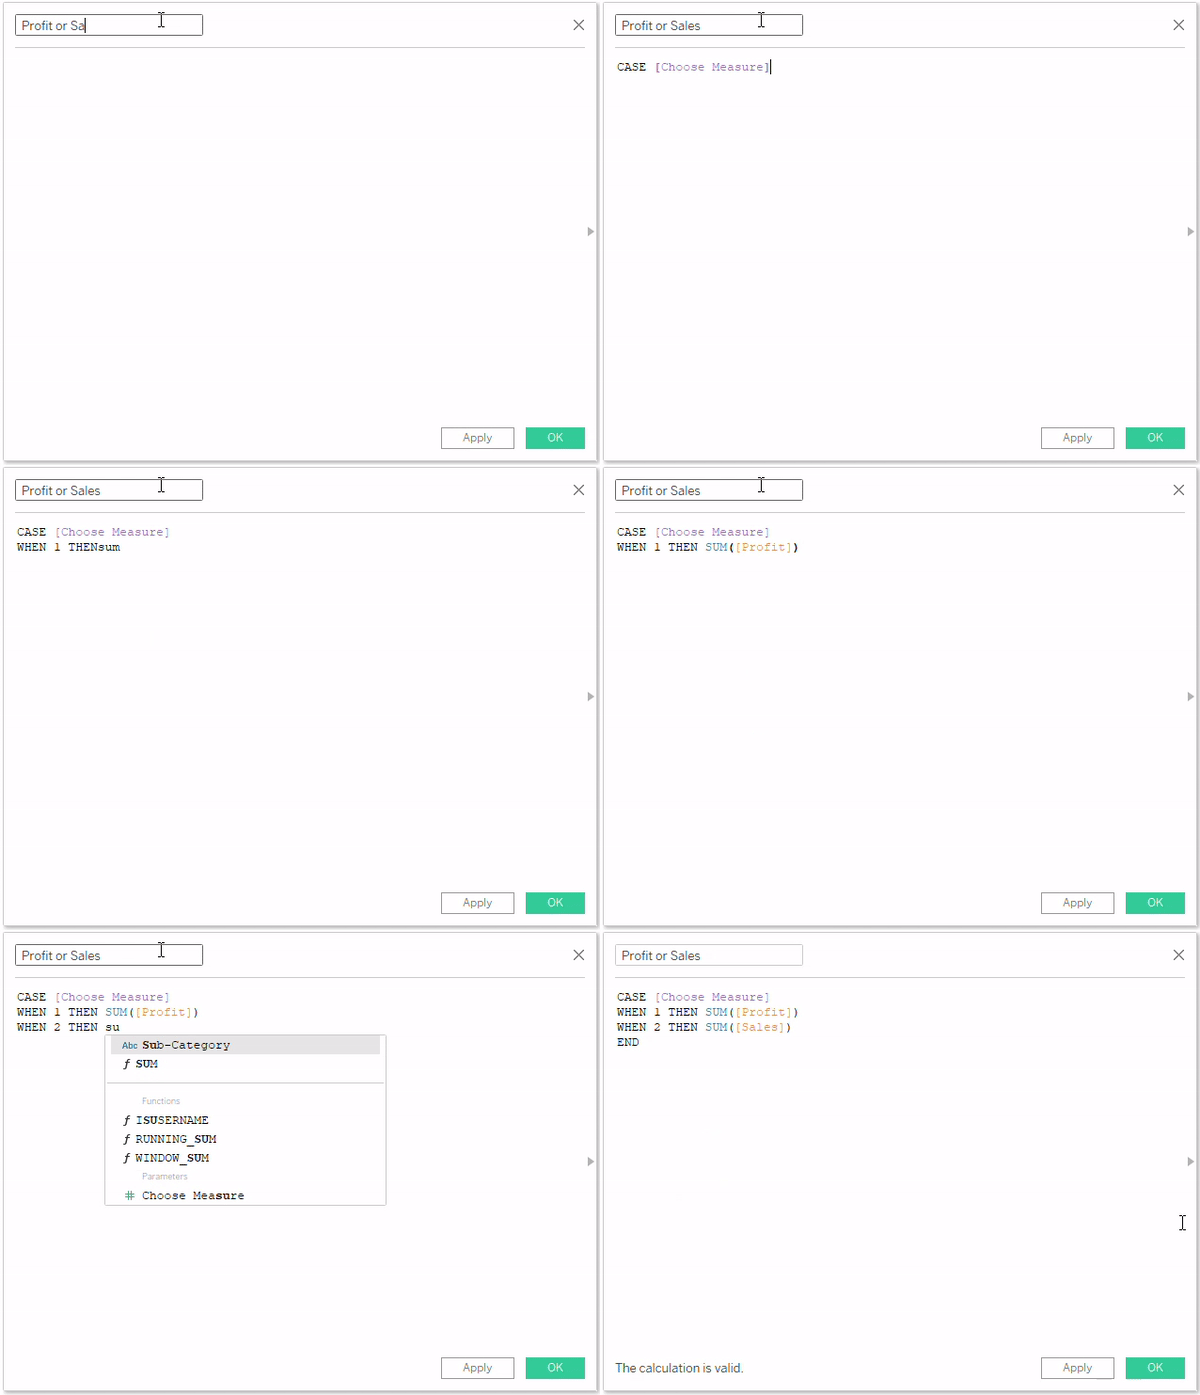
- Use the calculated field in the view by putting it on the columns shelf and optionally chnaging the type of list.
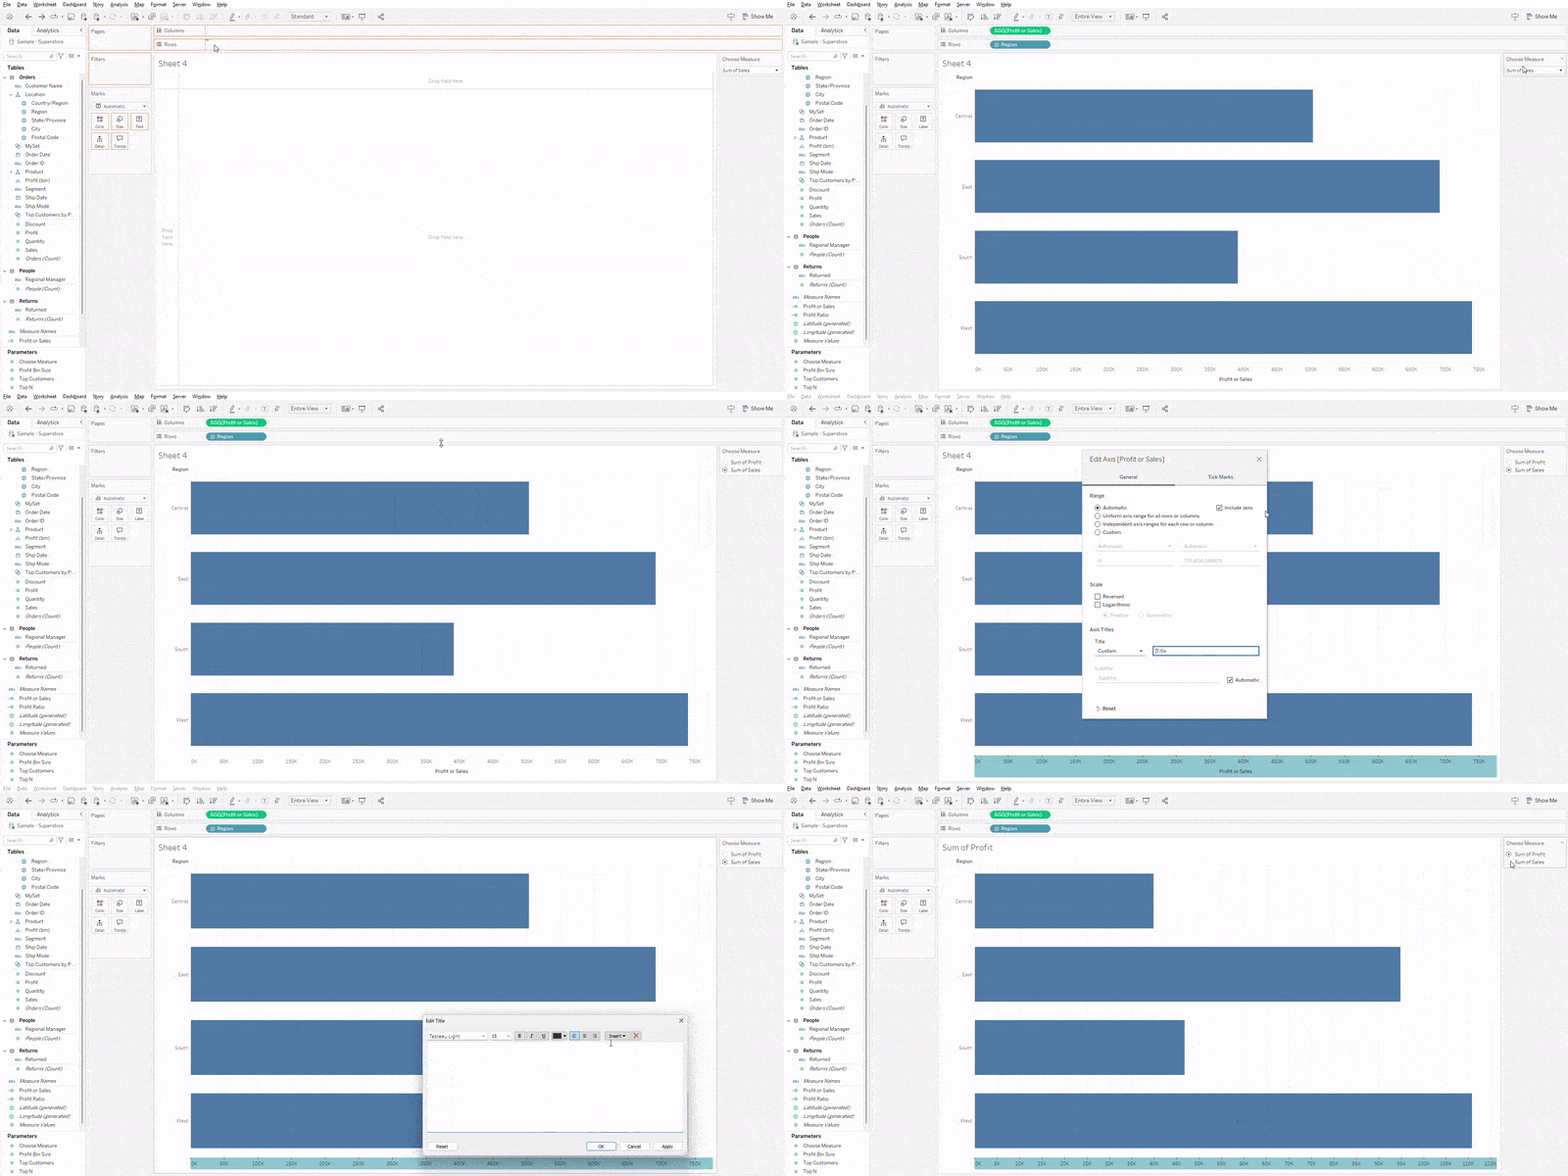
When users switch back and forth in the list, they can choose what to see in the view. The name of the axes can be removed and the value of the parameter inserted in the title to make it dynamic.
Conclusion
Parameters in Tableau go beyond use cases like switching between measures; they can also be leveraged for setting dynamic reference lines, controlling visualization elements such as Top N filters, and enabling interactive What-If analyses. Their versatility makes parameters a valuable tool for creating highly dynamic and user-friendly dashboards that adapt to different needs.
