Until a few weeks ago, I never used containers to build a dashboard. I would spend hours working on one dashboard with multiple floating parts. At the time it was fun until the dashboard needed to be switched around or the sizing changed. These are some of the major downfalls of using all floating elements in a dashboard, the inability to easily resize or move around elements, among others. Once you understand how to layout and use containers you'll be able to build dashboards more efficiently.
What are containers?
Containers are a way to group your charts, text, titles, etc. within a dashboard. By creating this group, you can position your data easily within your dashboard. This flexibility helps you quickly move around dashboard elements and find the best way to display your information. Tableau has two types of containers Vertical Containers and Horizontal Containers. You can find container options by going to your dashboard finding objects and selecting one of the top two options (see below).

Both Vertical Containers and Horizontal Containers work in the same way but they can still be very tricky to work with. However, it is important to note that Horizontal Containers work from left to right and Vertical Containers work from up to down. The most important step when using containers in PLANNING!
Containers in Excalidraw
Since discovering Excalidraw I have not touched a dashboard without carefully planning with it. For the below examples I'll be using #WOW2019 Week 19 to show how I build out my containers.
Below is how the final dashboard should look:

My first step in Excalidraw is to draw a dashboard template:
- I begin by starting with a floating Vertical Container.
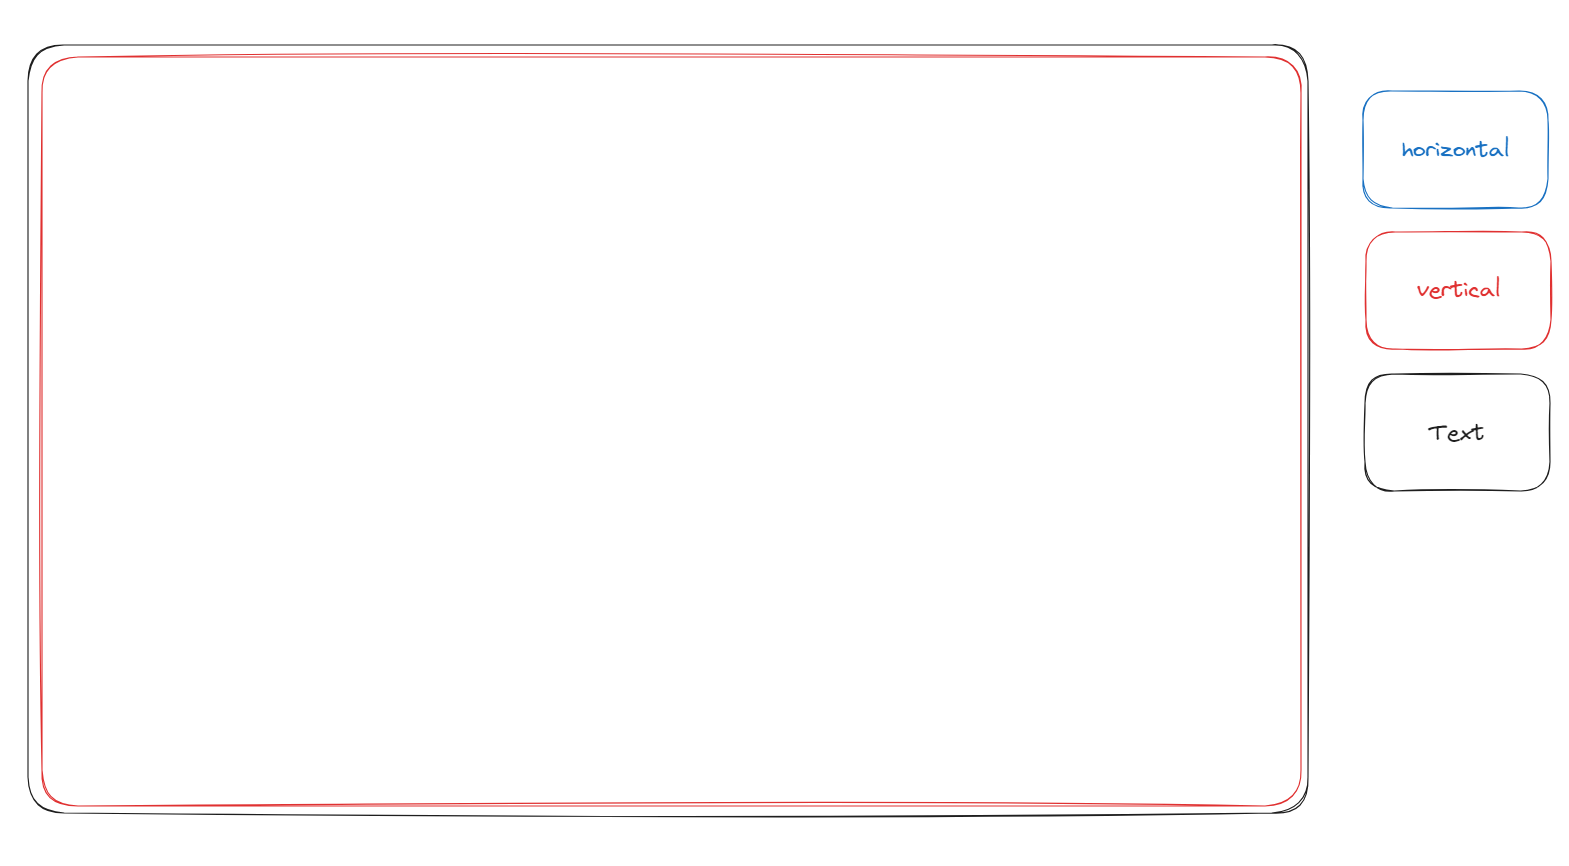
- Then I will place a text box on the top for the title and subtitle. Note I don't need to add another container as this is already a vertical.
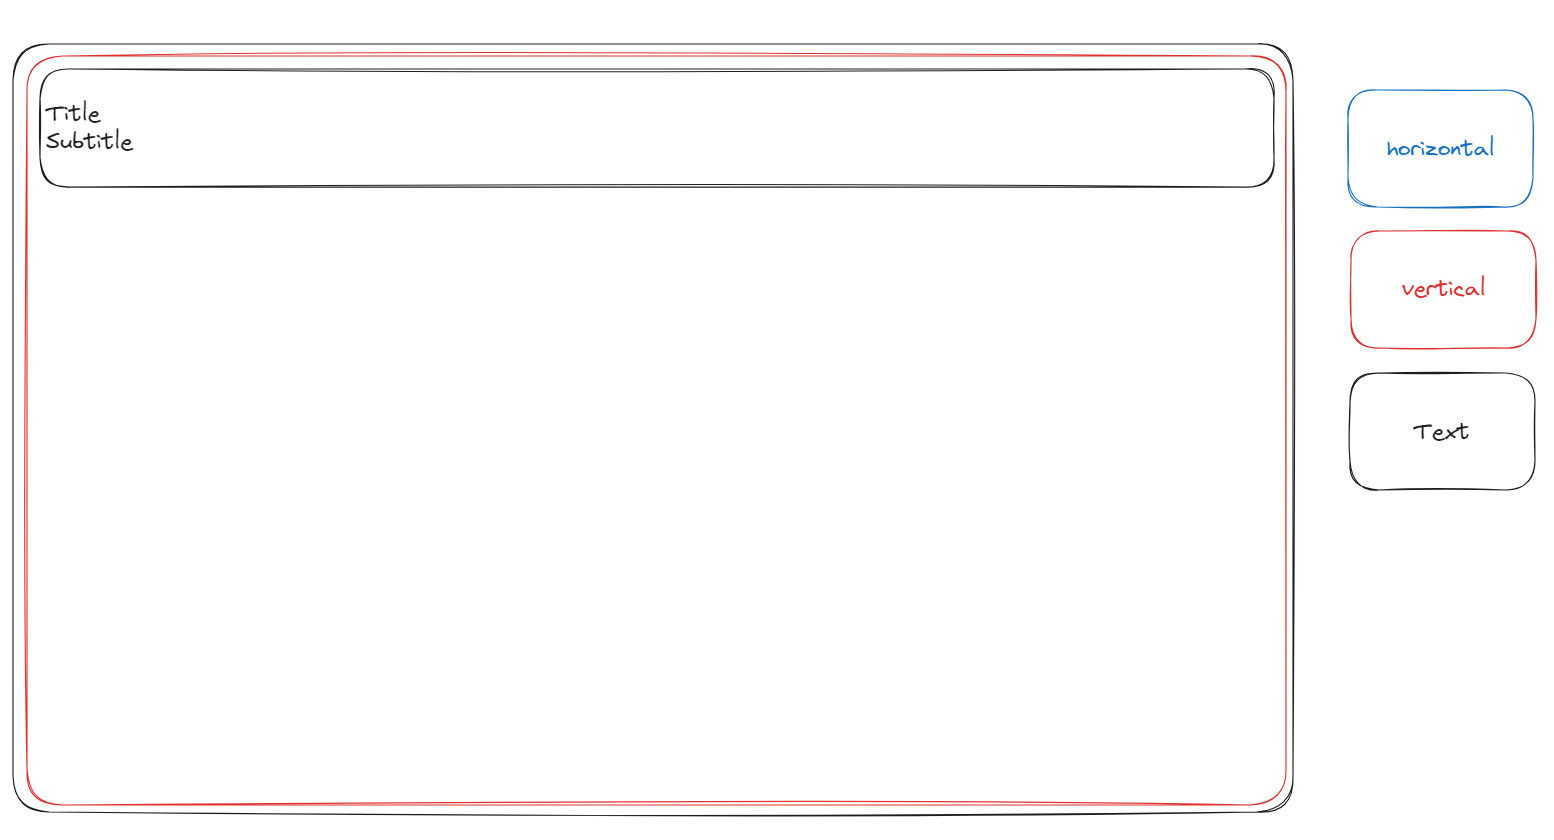
- Next, I will insert a Horizontal Container to separate the dashboard into left and right.
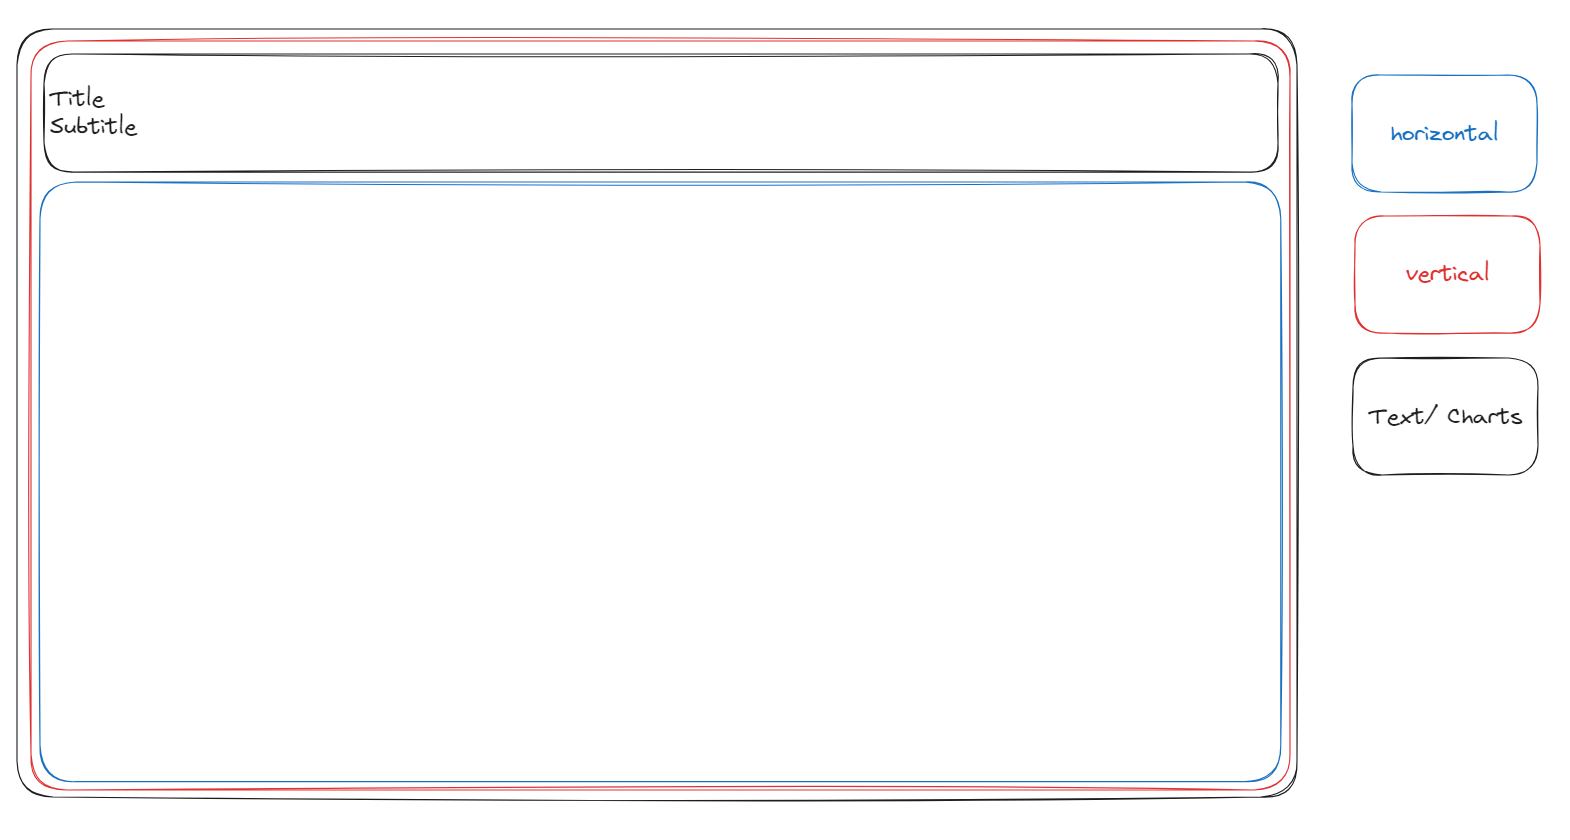
- Now I will place one chart into the horizontal container and add a vertical container to be able of insert the remaining charts.
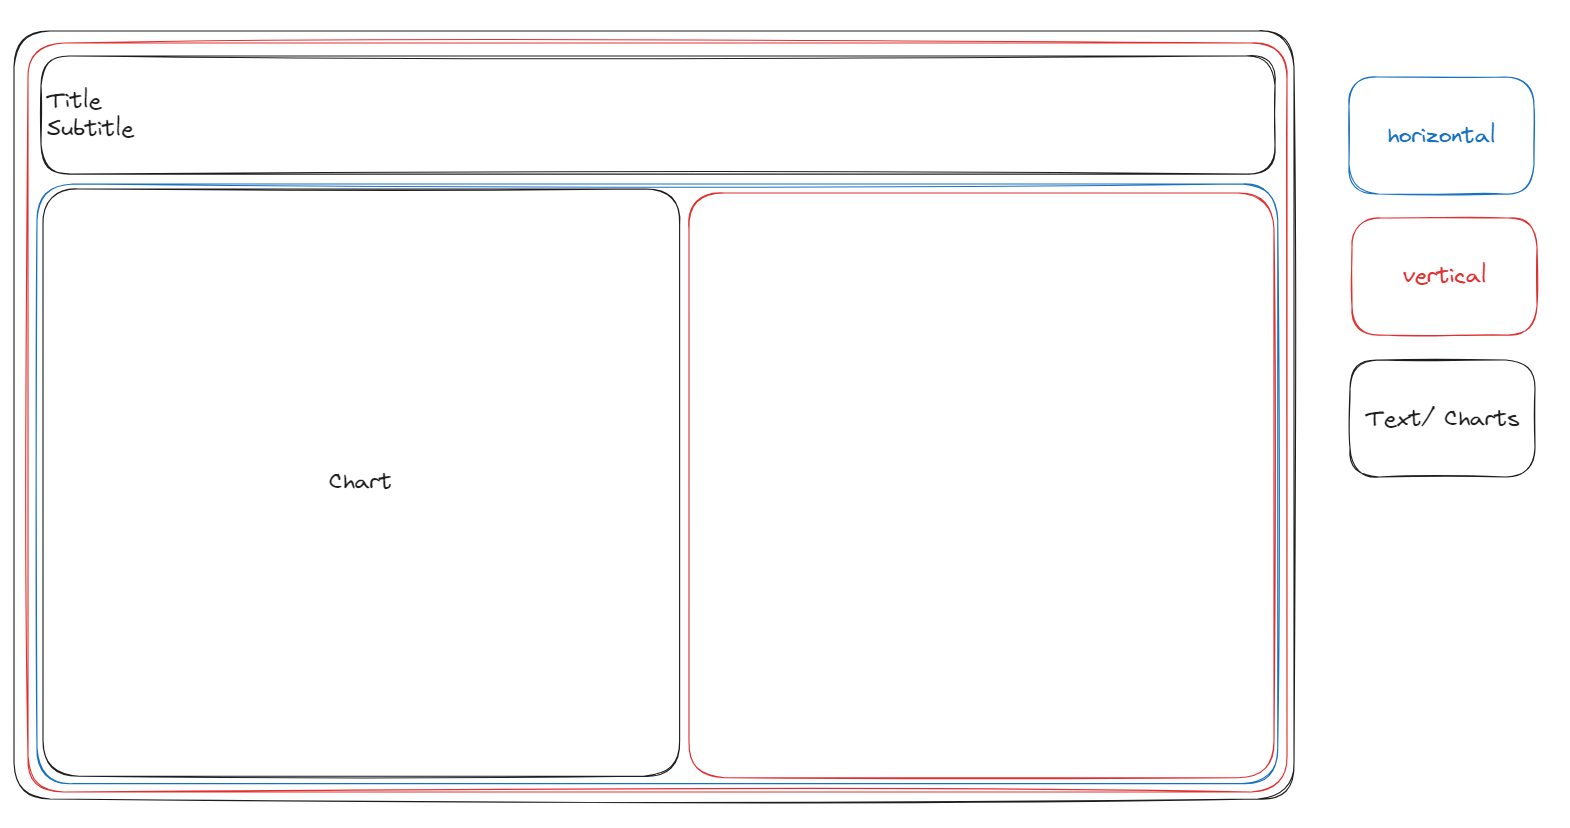
- Lastly, I will drag in the remaining three charts.
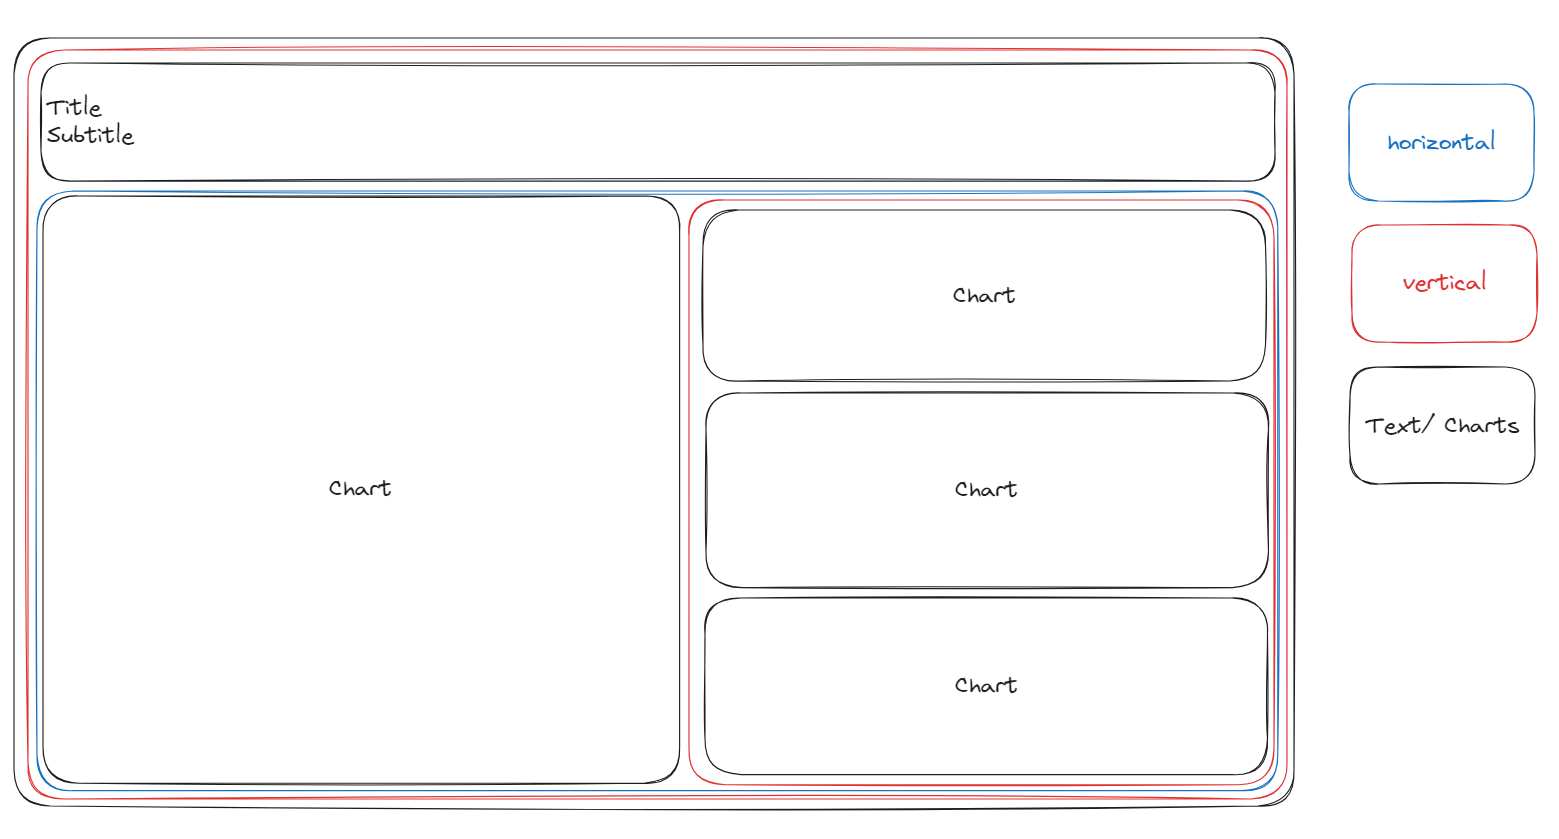
And just like that I have planned out all of my containers!
Container Tips:
- Use Excalidraw to create a layout for your containers.
- Use blanks/text objects to define your containers.
- Use borders to help outline where your containers are.
- If you double-click on a container it will bring you a level up to the next container.
