


And just like that ... it's a wrap! For the final day of dashboard week, we were challenged to create a dashboard from the dataset DSNY 5 used for their application viz. Normally, what would be a fun challenge became even more stressful due to torrential downpour in NYC. For this dashboard, I only had around 3 hours, which will be the quickest turnaround I have ever accomplished. Thankfully there was no data prep needed for this one that couldn't be done within Tableau.
The dataset: https://data.cityofnewyork.us/Health/DOHMH-School-Cafeteria-inspections-2020-Present-/5ery-qagt
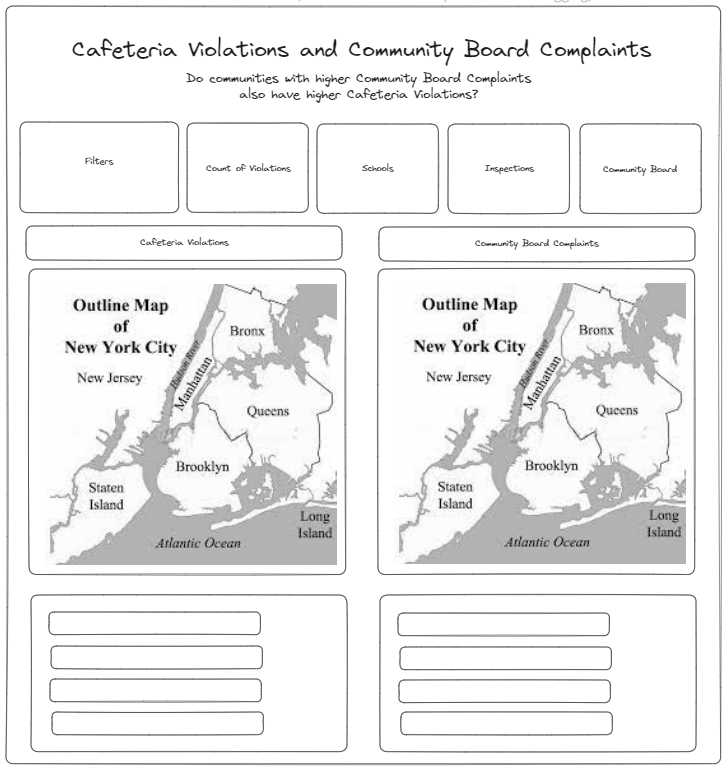
Wireframe
I've seen this dataset before so my mind automatically went to adding another dataset. The dataset I planned to use unfortunately wasn't easily available. I wanted to examine if there was a correlation between lower income tax levels and higher cafeteria violations. Once, I realized that idea wasn't possible I decided to focus on comparing community board complaints and see if a community board with higher complaints also had higher violations. Below is the wireframe I hoped to create as a dashboard. Spoiler alert: I didn't accomplish it.
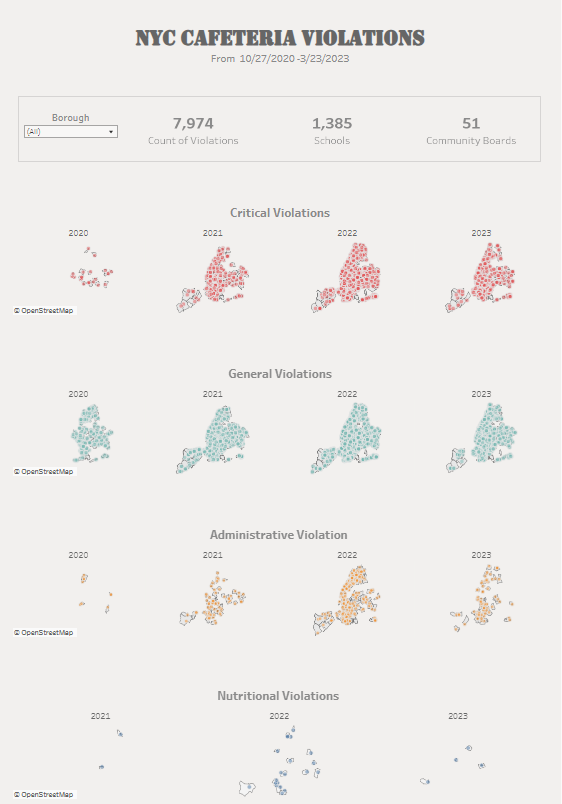
Tableau
For this dashboard, I wanted to show the violations and how they increased or decreased across the years. This is still very much in the beginning stage and I hope to include more visuals to show the actual number of changes.
You can view the dashboard here.