


It's day 3 of dashboard week and I am here to report that things have gotten easier but also more challenging!
Today's challenge was focused on APIs, specifically a really thorough one on Rick and Morty. As a fan of the show, I was super excited to begin working with the data.
We had to call the API from the following website: https://rickandmortyapi.com/
The API was broken up into 3 different sections: characters, locations, and episodes.
Since I knew there was so much information I focused the earlier part of my day building out a wireframe.
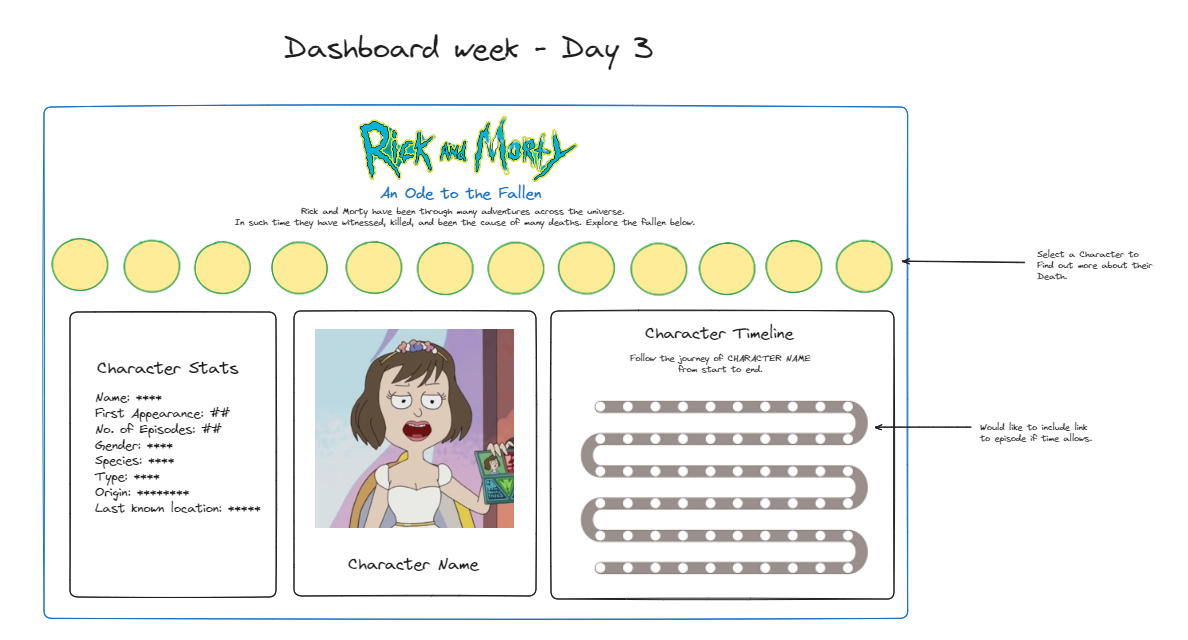
Wireframe
If you have ever watched Rick and Morty you know there is an obscene amount of deaths shown throughout the episodes. My idea was to create an ode to the dead and show who they were and their character stats. Below was my initial idea for the dashboard, which of course morphed as I began to explore the data (hint: it the character timeline was not possible as most dead characters only appeared in one episode.)
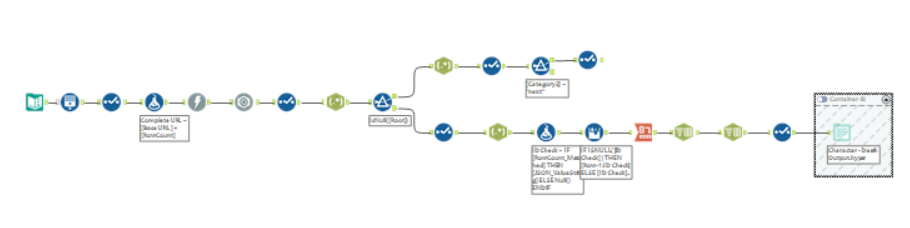
Data Prep
Now, that I had an idea of what I wanted to create I moved into Alteryx to call the API and clean the data. What proved tricky with calling this API was the pagination. I have always struggled with pagination and I wanted to use this opportunity to create an iterative macro. I unfortunately was unsuccessful in my attempt as I noticed later on the iteration I created didn't align with my input. Since I was pressed for time I generated rows for the exact page count I knew the API had. Once that was completed I had a complete dataset and I was ready to jump into Tableau.
Dashboard
The last step in my process was to create a dashboard in Tableau. Though I have had more insightful and cleaner dashboards I had a lot of fun creating this silly dashboard. I also got to use the image role feature within Tableau and learned that it begins to glitch after 500 in Tableau and will not show images after 100 in your draft but it will appear when published. For this dashboard, I also incorporated the webpage function within Tableau which posed its own sizing difficulties but worked well within this context.
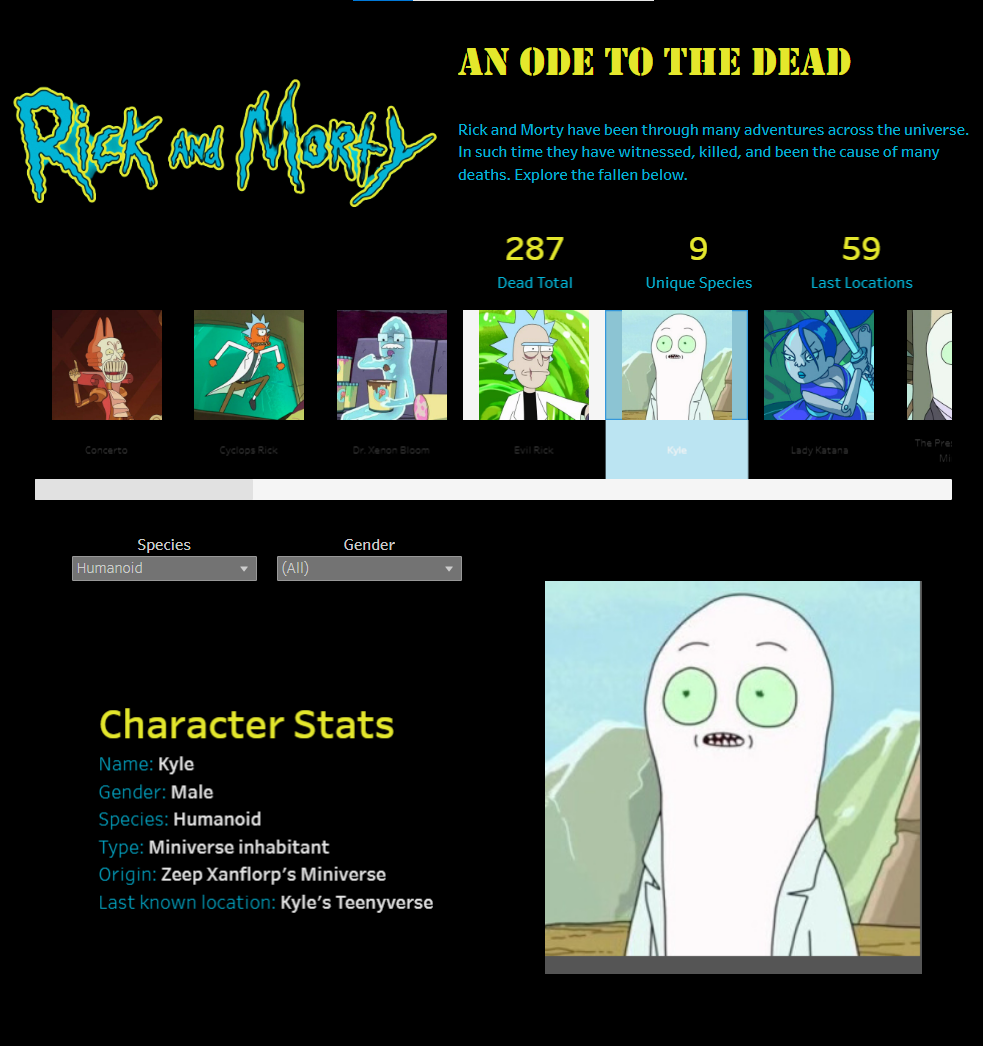
Feel like interacting with the dashboard, check out my dashboard here.