


For day 2 of dashboard week, we took on survey data! The data set explored the preferences, interests, habits, opinions, and fears of young people. The survey data was conducted in 2013 and all participants were of Slovakian nationality aged between 15-30.
The Data:


Wireframing
For this day I wanted to try something I had never done before SUNBURST charts! My wireframe was broken into 6 different sunbursts and looked at 6 different questions. I wanted to include a brief summary of how the data was collected and included a few BANs to give the data context. I planned to have each sunburst filtered by parameters.

Data Prep
I wanted to take a step back from Alteryx and tried to use Tableau Prep for this project. The flow I created can be found below:
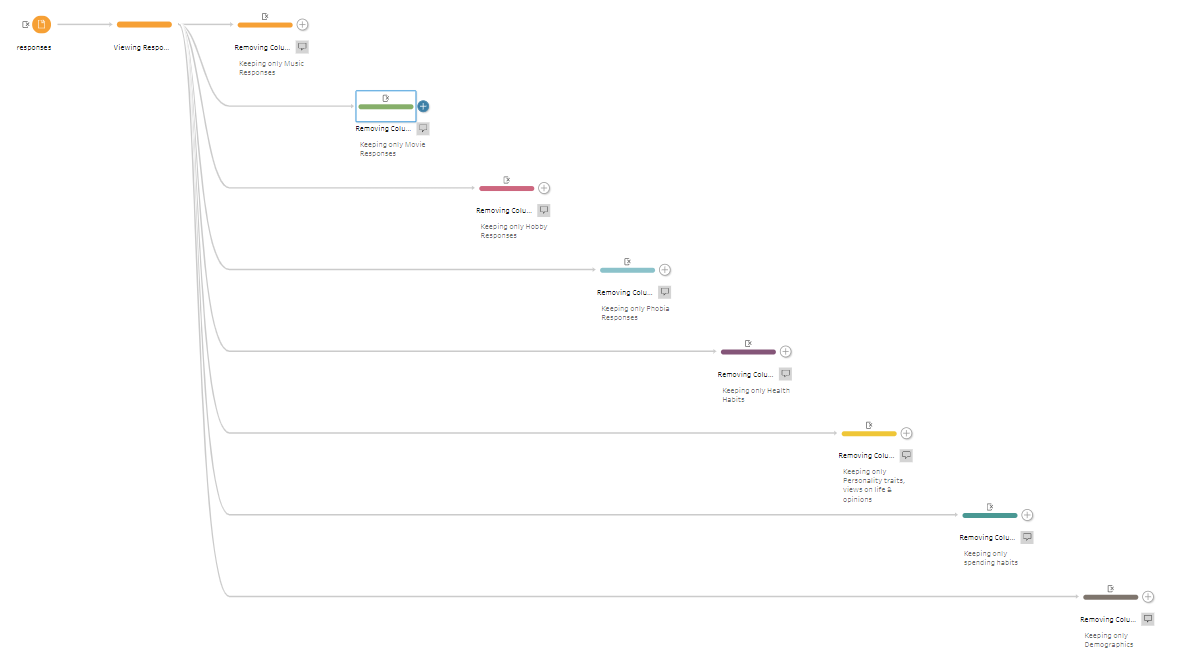
My initial thought in this flow was to create separate files since I wasn't thinking of using all the data. However, I hit a snag when I wanted to rename multiple columns... so I moved into Alteryx.
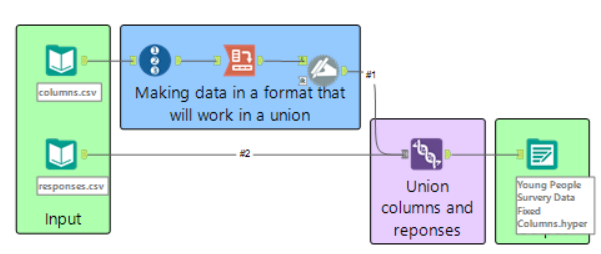
In Alteryx I used the recordID tool to create an id for each row in the columns table. This step had to be done prior to the cross tab tool because otherwise Alteryx would sort the columns alphabetically and it would be difficult to union later on. Once the data was transformed I used dynamic rename to replace the created record IDs with the columns full name. After that, I used the union tool to combine both tables positionally. The last step was to output the data as a hyper file.
Tableau
It was now time to put the data into Tableau and build out my dashboard. I built each sunburst by using map layers. Though I didn't get all 6 views in I'm glad it turned out the way it did and I got plenty of practice creating multiple parameters and calculations.

Check out my dashboard here!