


Dashboard week is in full swing in the NY office and for day 1 our challenge was to web scrape the German Bundesliga Website and then build an interactive exploratory dashboard. Some of the questions we should have thought about in our dashboard creation can be found below:
- Who is the intended audience for your dashboard?
- What would they like to know about the teams?
- What sort of comparisons might they want to make?
- How can you provide a smooth experience enabling your users to find answers to their questions?
All of this was to be completed between 9:00 a.m. - 3:30 pm with a presentation and a blog post by the end of the day.
Wireframing
To start the day I spent around 30-45 minutes planning the dashboard I hoped to build by 3:30 p.m. If there is anything I learned from 8 weeks of client projects, it is that creating a wireframe helps keep me focused on a task. Also, I have found them incredibly helpful when the timing doesn't go my way.
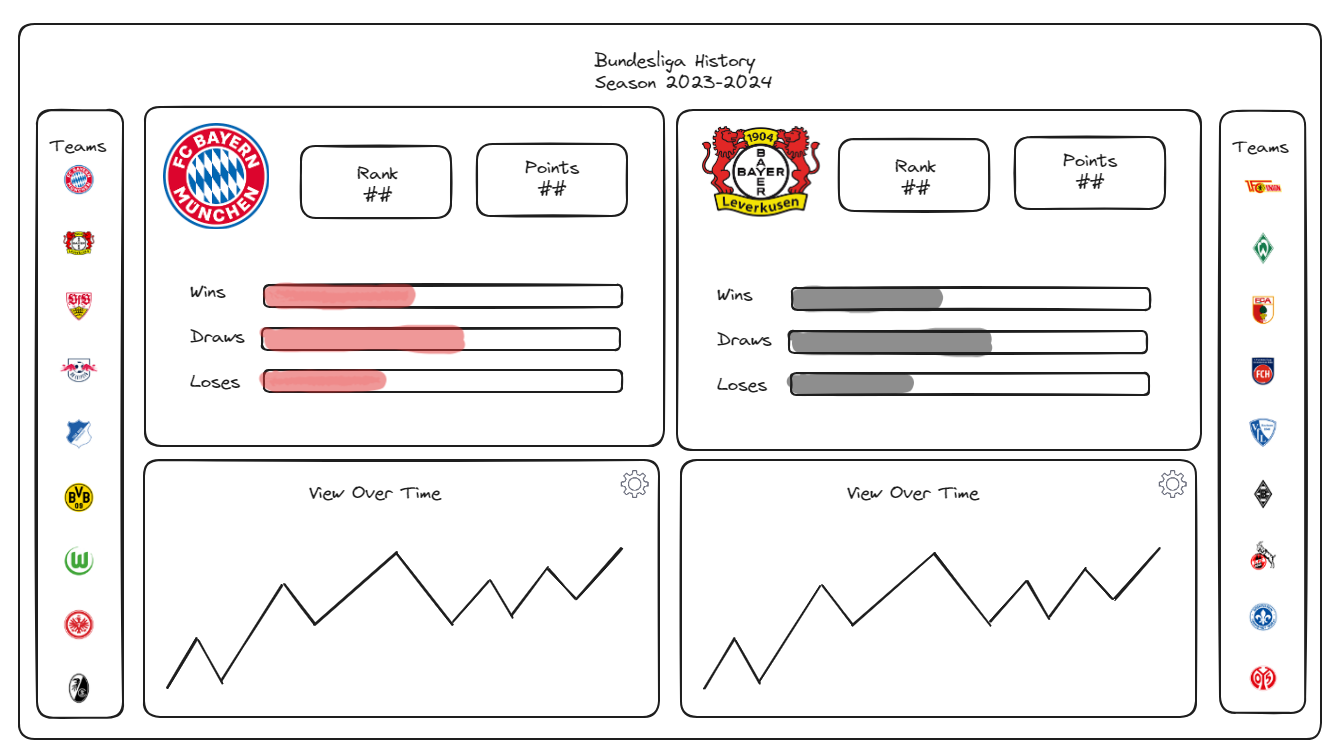
The main point of my dashboard was for the user to select two teams to easily compare how they performed in any given season. The team selection would be through the team icons found on the left and right of the charts.
Web Scraping in Alteryx
Now, that I had my wireframe built it was time to dive into web scraping.
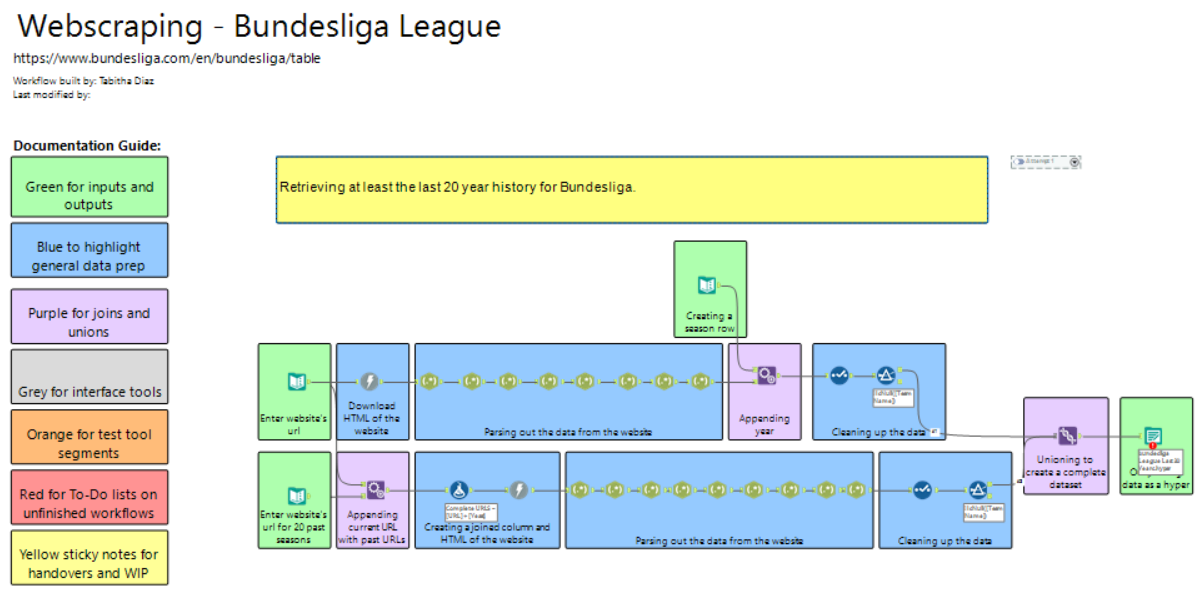
The flow shown above is a common way to scrape data from a website. I began by inputting the website URL in a text input tool. I then used a download tool to get the website information and from there I began to use regex. The first step in my regex process was to find the line of code where each team began and ended. Once I established the start and end I then tokenized the field in order to get each team on it's own line. The rest of the regex tools are pulling out separate columns that I would need for my analysis. I think used another text input tool to gather a little over 20 years of historical data from the table. A lot of this section looks the same as the original scrape. In the end, I cleaned up the data to only include columns that were needed and then unioned the data to then output it as a hyperfile for Tableau. This part is where I spent the majority of my time as it has been a while since I have done web scraping and definitely hit some major speed bump in the process.
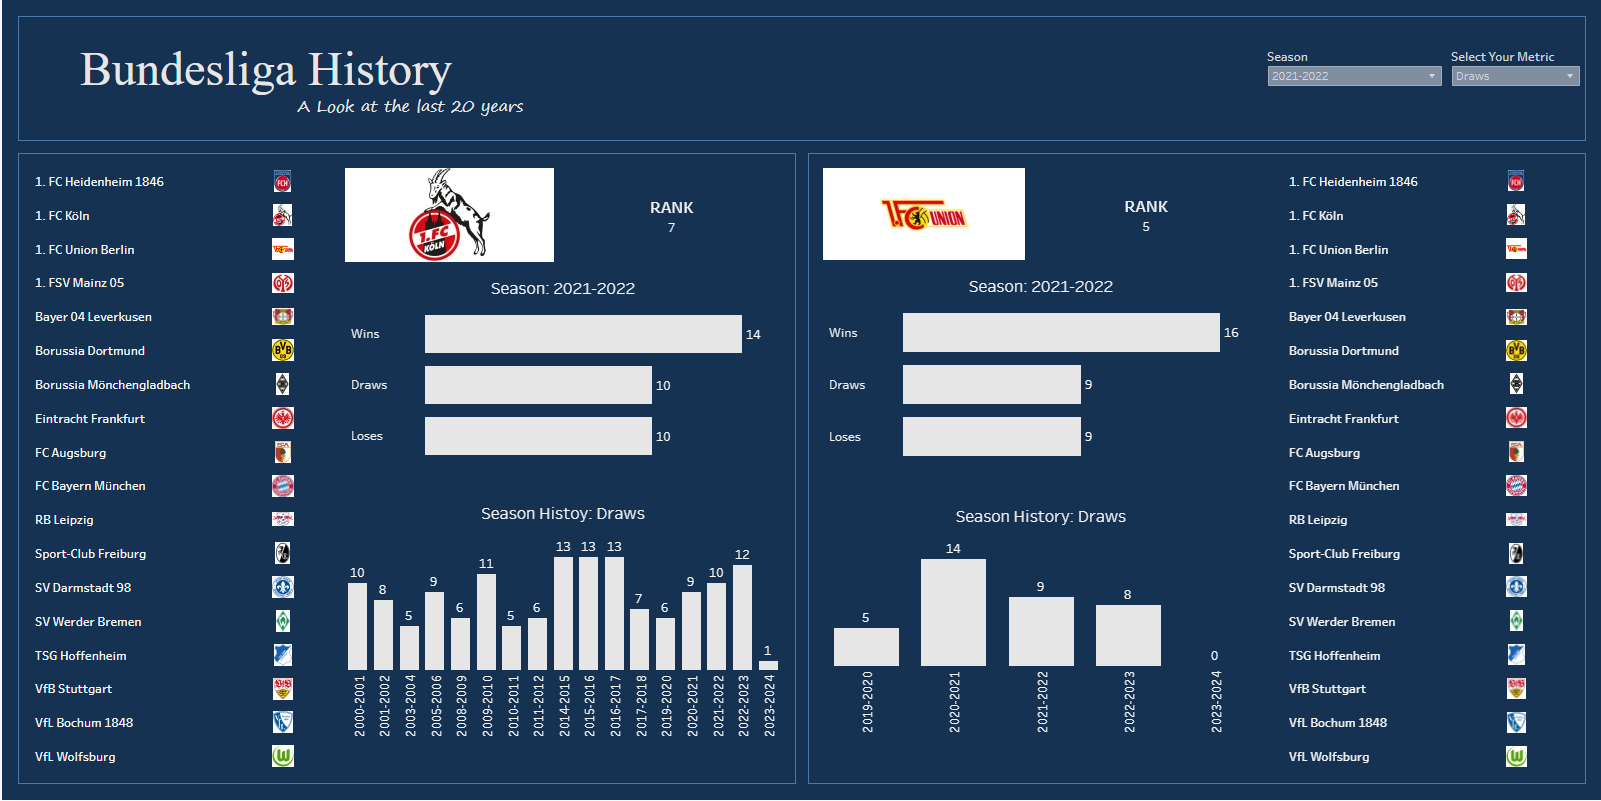
Tableau
Unfortunately, due to time constraints, I wasn't able to spend much time in Tableau but, am happy with what I was able to accomplish in a little under an hour (thanks to my wireframe!). A main focus of mine for this dashboard was constructing filter actions. This was my first time using filter actions and it was necessary for the style of dashboard I was building. When I work with filters I normally filter out an entire dashboard instead of just one/ multi-sheet. It was a really fun challenge to map out which filters needed to trigger certain dashboards and which didn't.
At the end of the day, I am extremely happy and proud of all I was able to accomplish in a little over 5 hours. I can't wait to go back to this dashboard to fix it up even more and make it more aligned with my original wireframe.
Check out my dashboard here.