This blog post is aimed to help you create a 4- colour quadrant using the sample superstore data.
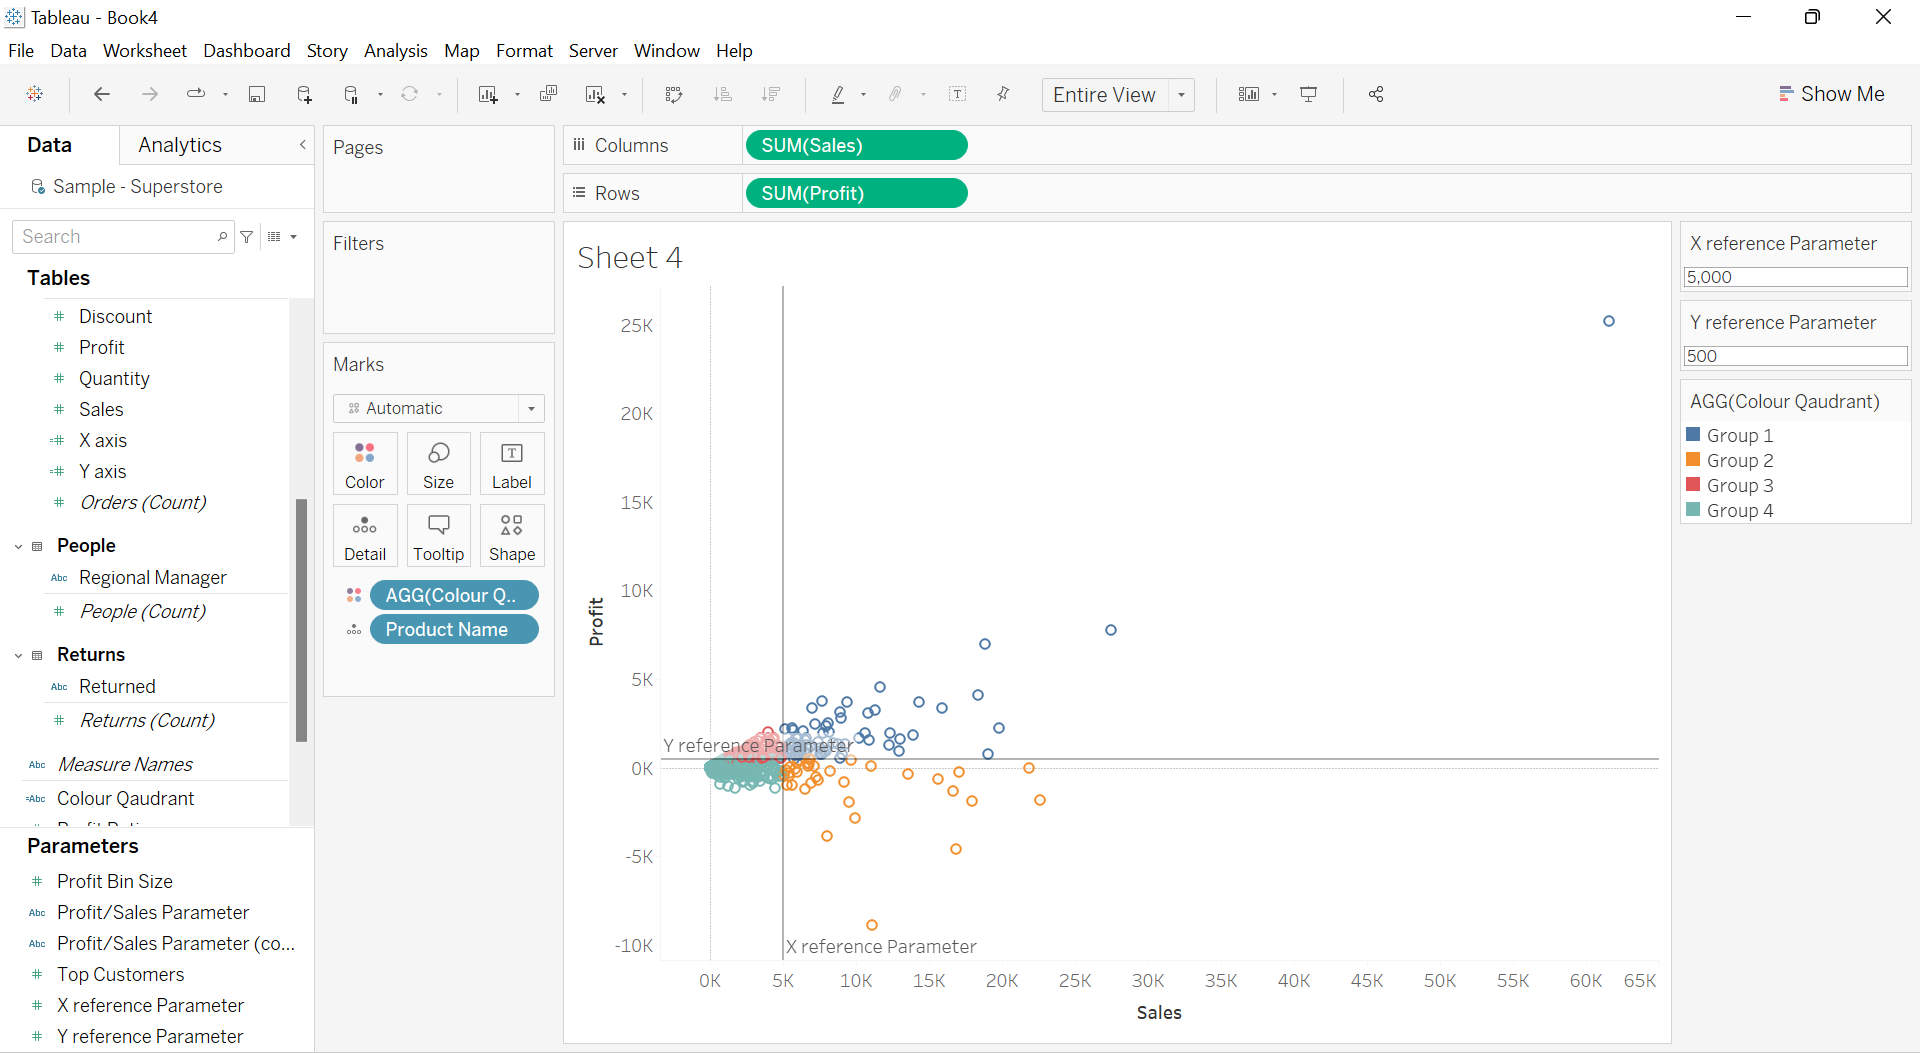
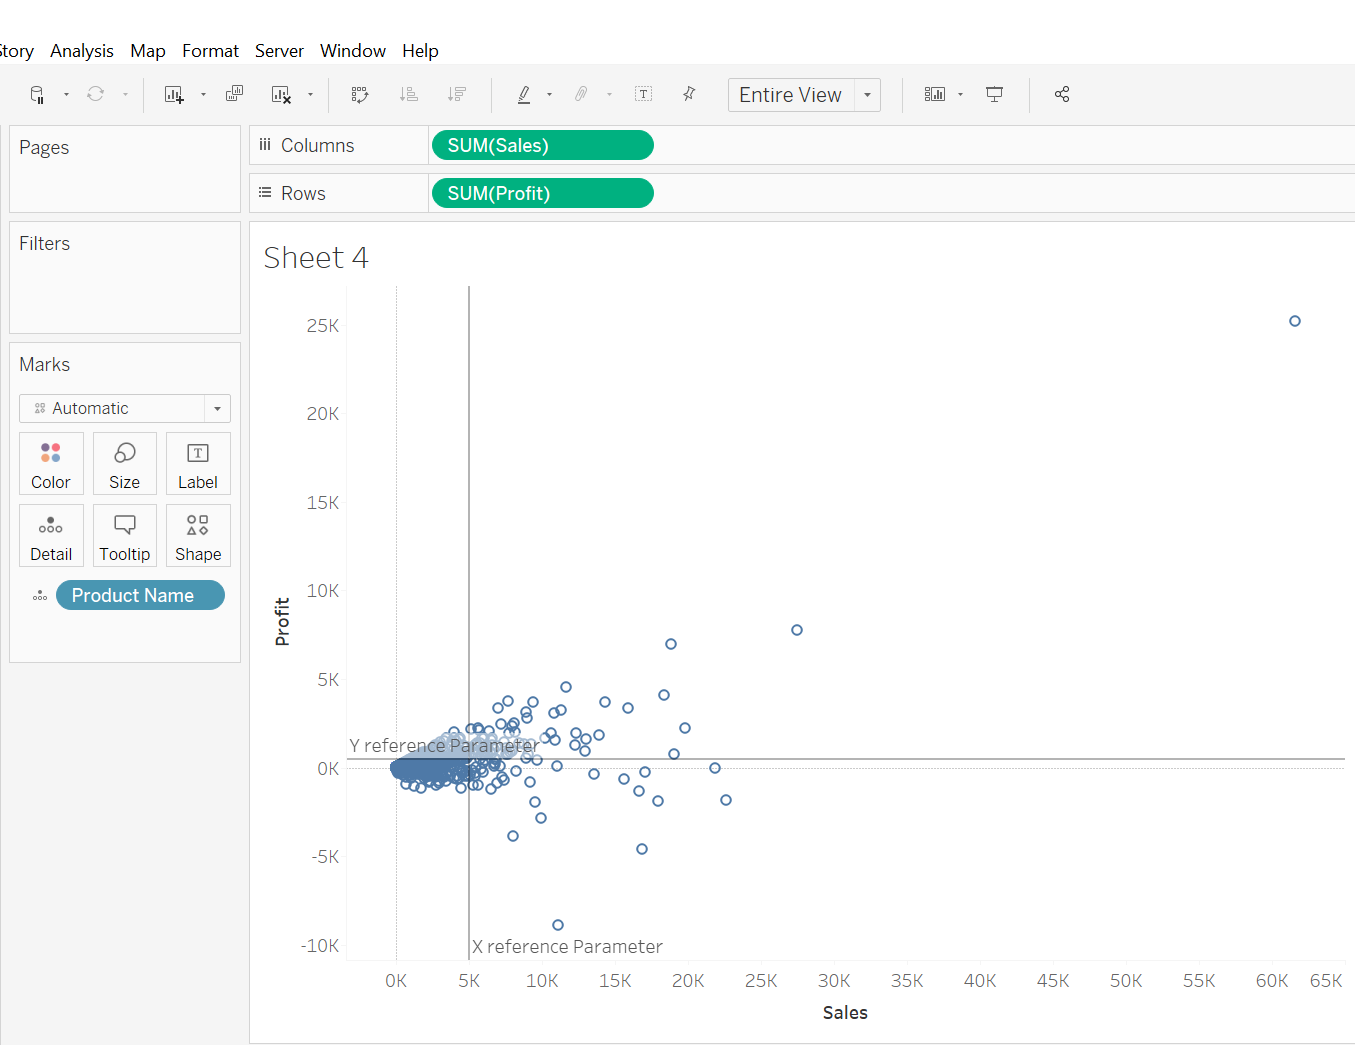
You will need to begin by first creating a scatter graph and add reference lines for both axis.
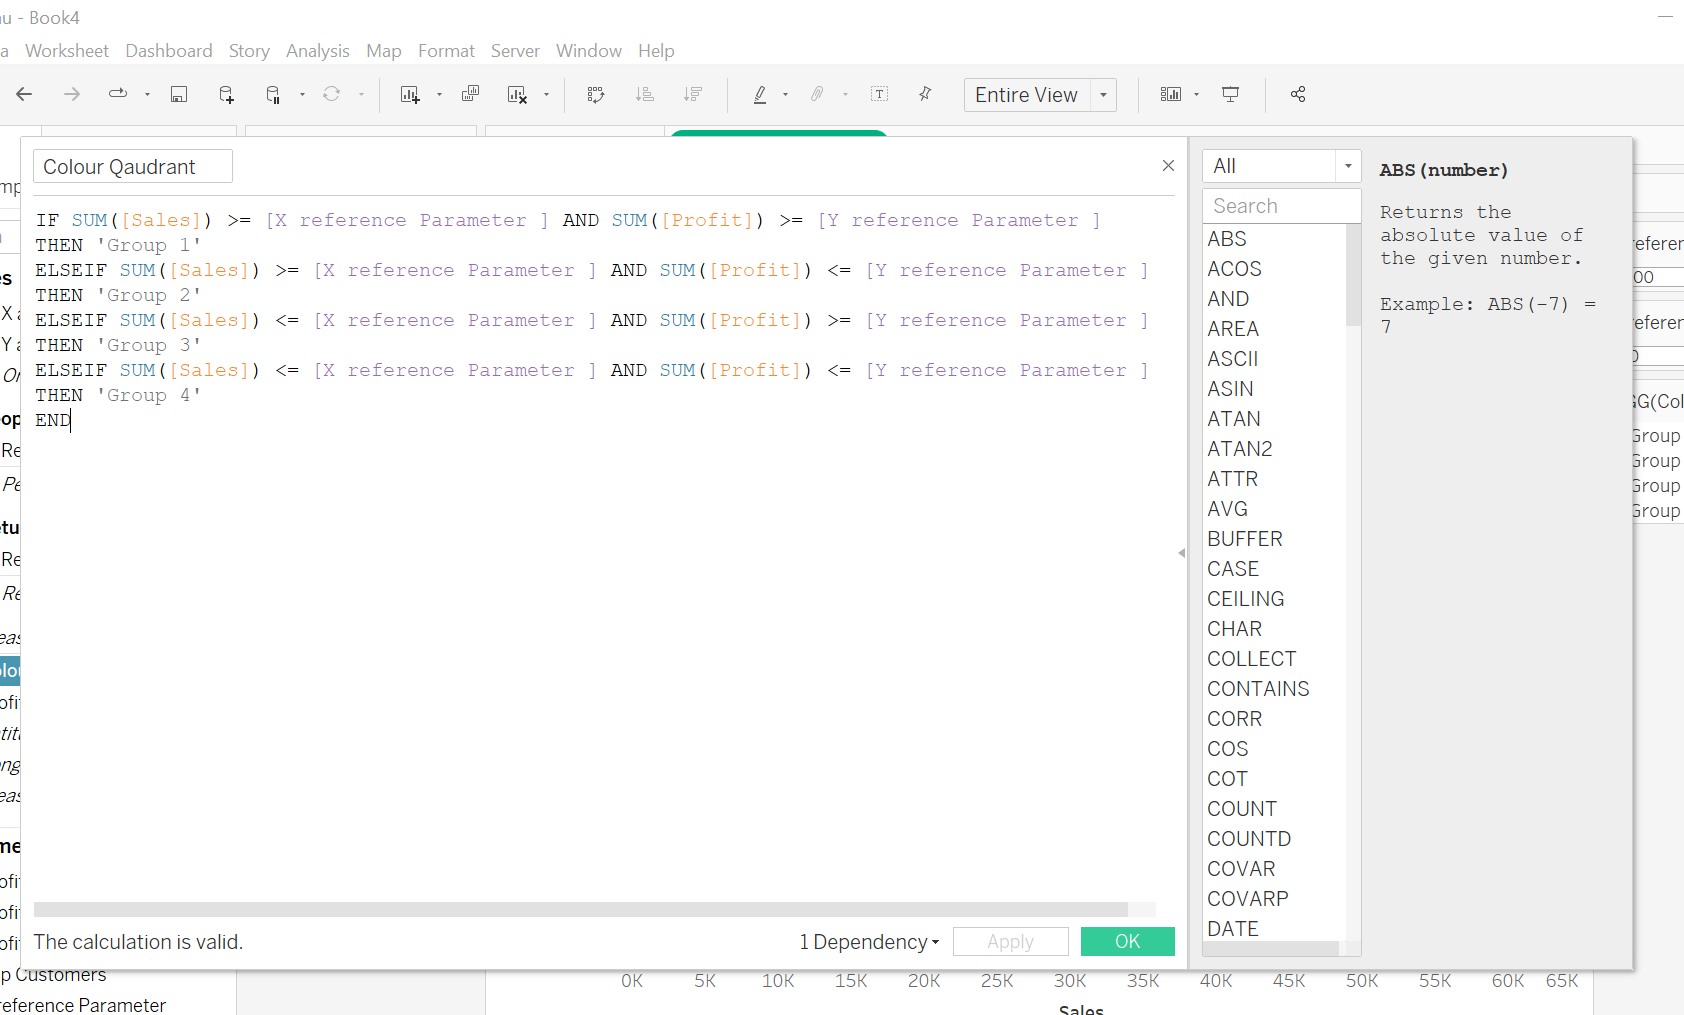
Then create a calculated field
then add your new calculated field to your marks card as a colour