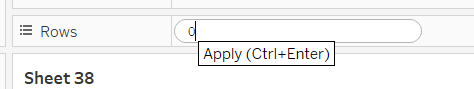
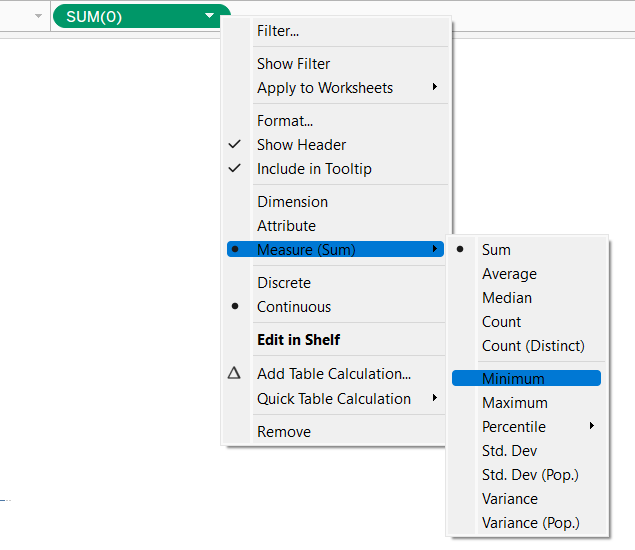
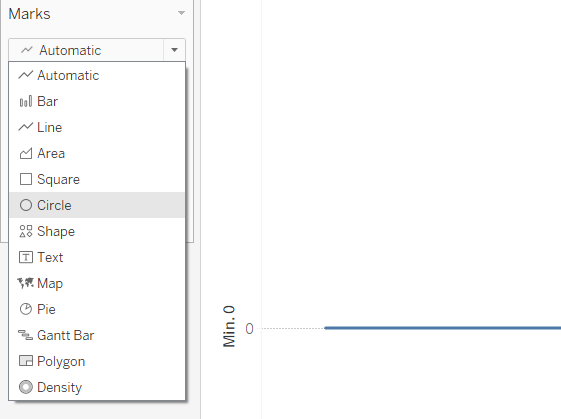
Step 1: create a 0 min line to get your time line
![](https://www.thedataschool.co.uk/content/images/2022/10/image-344.png)
![](https://www.thedataschool.co.uk/content/images/2022/10/image-345.png)
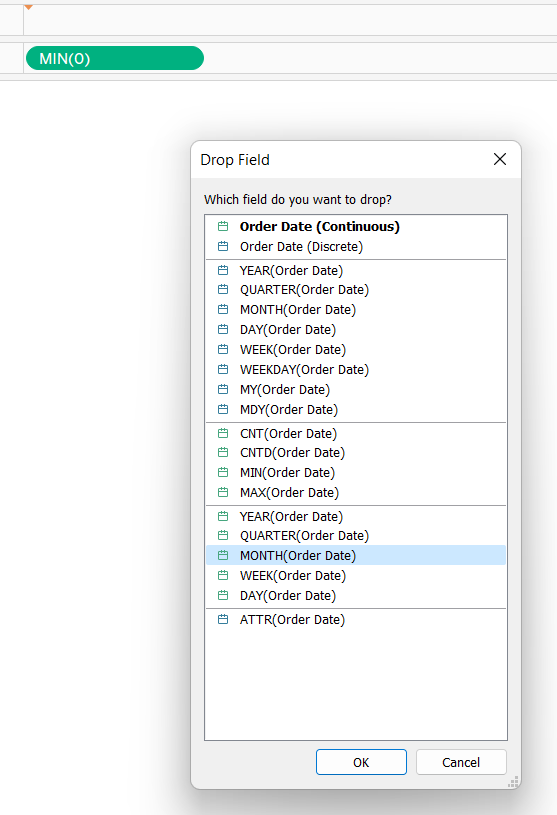
Step 2: Choose your date part and place it in columns
![](https://www.thedataschool.co.uk/content/images/2022/10/image-347.png)
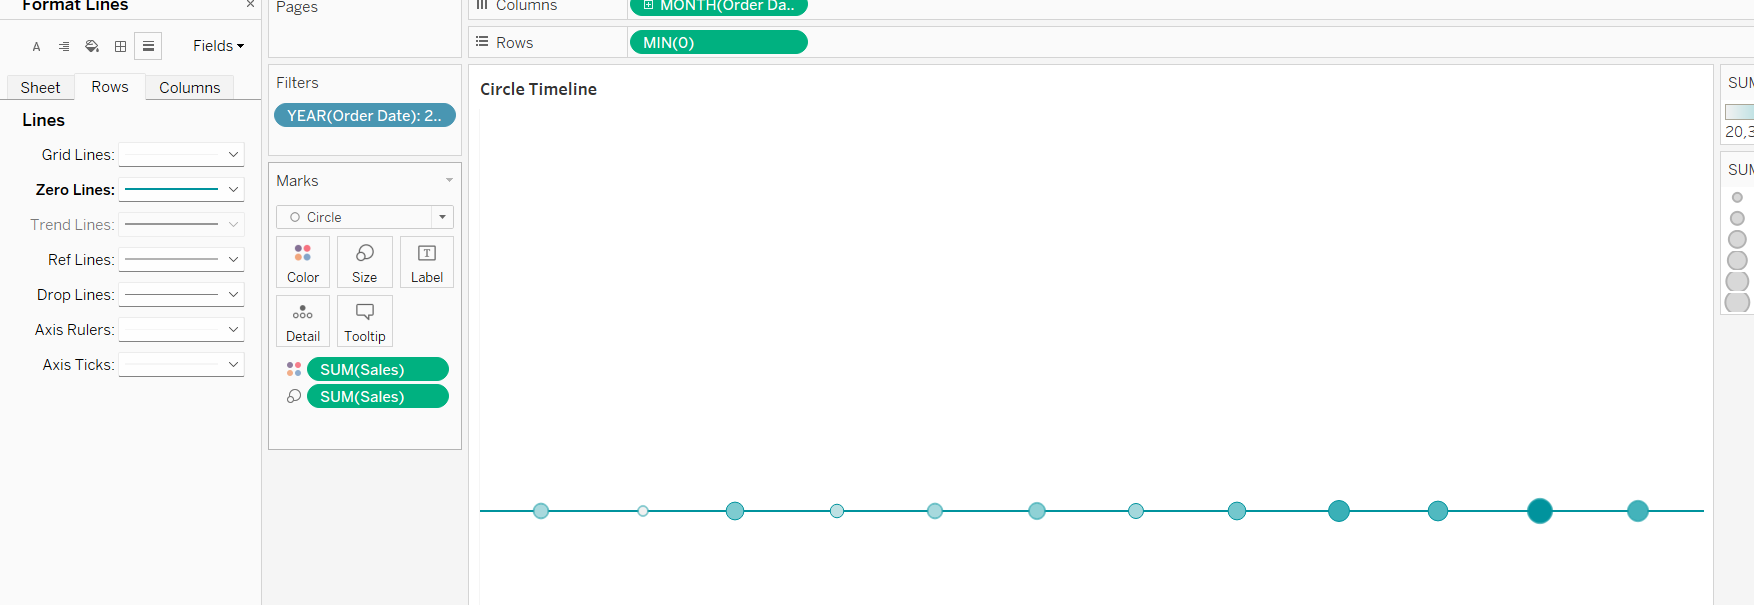
Step 3: turn your line into a circles and place the measure you desire to see over time
![](https://www.thedataschool.co.uk/content/images/2022/10/image-351.png)
![](https://www.thedataschool.co.uk/content/images/2022/10/image-350.png)
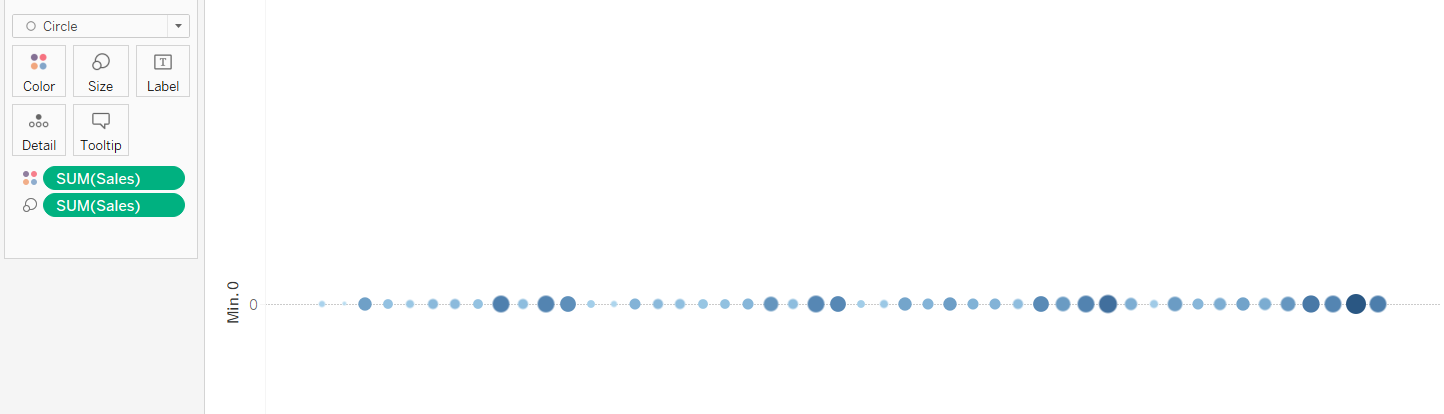
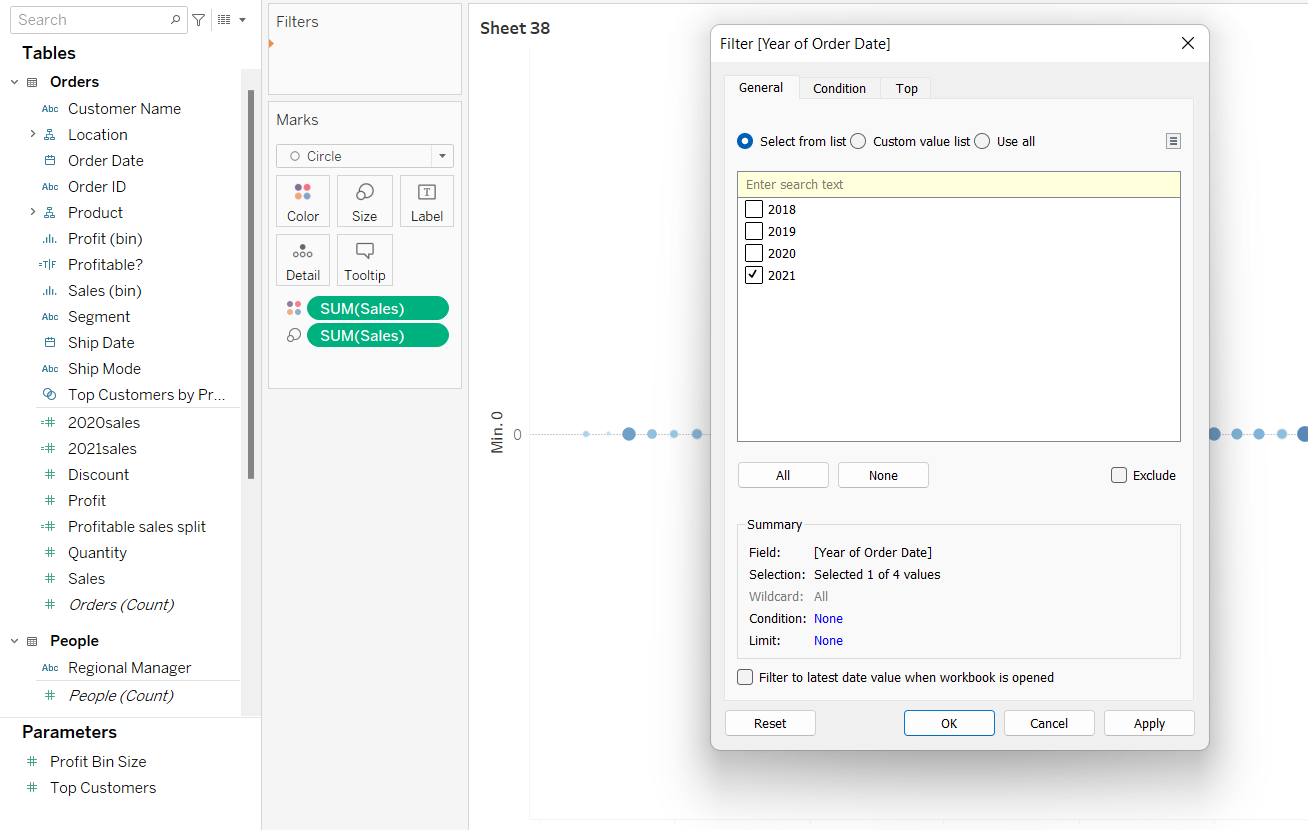
Step 4: filter for a year or any other date part of choice and format your zero line to be the colour of choice.
![](https://www.thedataschool.co.uk/content/images/2022/10/image-352.png)
![](https://www.thedataschool.co.uk/content/images/2022/10/image-353.png)