The task today was more analytical in nature and there was a heavy emphasis on asking questions. We had survey data from 1992-2019 . Below are the questions I wanted to initially answer, before the inevitable data difficulties!
- Did the majority of respondents smoke menthol cigarettes?
- How were the ages of first smoke related to frequency of smoking?
- What was the average smokes per day for each age bracket
- How many respondents started within the last year?
Sadly I didn't answer any of these initial question in the end deciding to look more closely at whether everyday smokers would quit.
Further to this there was a guidebook which yielded a few more questions to answer;
- What is the current cigarette smoking status and amount smoked;
- What has the use of menthol cigarettes (since 2003) been like;
- What is the smoking history, quit attempts, and intention to quit?
- What are the levels of nicotine dependence (since 2003);
- What is the cost of cigarettes and purchase location (since 2003);
- What are medical/dental advice to quit;
- General cigar, pipe, and smokeless tobacco use;
- Future harm reduction and other emerging products (since 2003);
- General workplace and home smoking restrictions;
- What are attitudes toward smoke-free policies in public places?
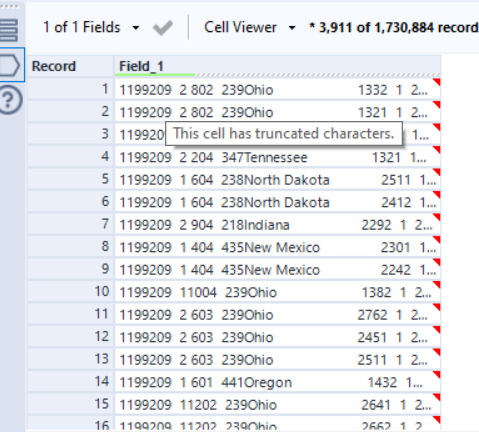
Having said all this, today was a departure from what we have previously done. Namely the introduction of statistical files. Below is the appearance of the data

I did a quick bit of googling, trawled the Tableau Community forums and posted on Convo yet wasn’t able to find a quick fix to the import of SAS files into Tableau. So my first challenge was naturally getting usable data, after much experimentation I finally found a solution attached in the workflow below.
It should be noted that we were using survey data from 1992-2019, naturally there were some hiccups in the generation of the data table, but ultimately it was overcome due to the data dictionary and the fact each column was considered a separate character. This alongside the formula tool joining the values yielded some useful answers to questions.
I have included a screenshot of the empty data tables, these questions ought to have been answered by some of the records but given their similarity to the previous questions I believe they have been harmonised into one column.
Having narrowed down the data significantly I really focused on three questions which could be sliced by Year/Month, Region, State, Age, Sex and Family Income.
Yielding the result below;
So to recap the Alteryx Workflow
- Import the .dat file and use fixed width
- Regex on each character using the ‘.’
- Filter the character which had been concatenated to produce a 2018/19 and 1992-2015 dataset that could be unioned
- Went through some onerous formula to merge values together
- Unioned the data and removed all the excess columns caching along the way
- Remove the last columns which were empty
- Used string values to replace the numbers so it is intelligible when visualising
Now to Tableau
Due to the aforementioned questions I was able to look at the everyday smokers and try to judge their intention to quit. The answer sadly is a resounding NO. Having said this the number of respondents has been decreasing steadily which would suggest that there is a smaller sample size and given the variables of wealth and age suggest a likelihood that everyday smokers are becoming less common.
Challenges today were;
- The statistical file and resulting work leading to more narrow questions of the data
- Finding useful insights in Tableau that could be easily communicated
- The quantity of data was significant so narrowing down and finding the right and useful data was challenging
If I had more time I would have liked to try turning the three pillars into a sankey to show the split in a nicer way and perhaps have brought in some more comparisons across the dataset.
In conclusion, I learnt how to manipulate statistical files, utilised RegEx in a manner I am satisfied with and narrowed down on some core questions from an expansive dataset. In future I want to focus on bringing more comparisons and perhaps producing the sankey.
