


Overview:
When filtering down data in Tableau, you might find that graphs only show relevant headers in the rows and columns - the ones that have data points.
In some cases, this is not the desired outcome, and we actually want to see all headers from that dimension, even the empty ones.
This is most applicable for:
- Calendar heatmaps or any time-series data when looking at an entire date range
- Bar charts when empty space is insightful
- Any visualization where you want to see all possible values
Before and After:
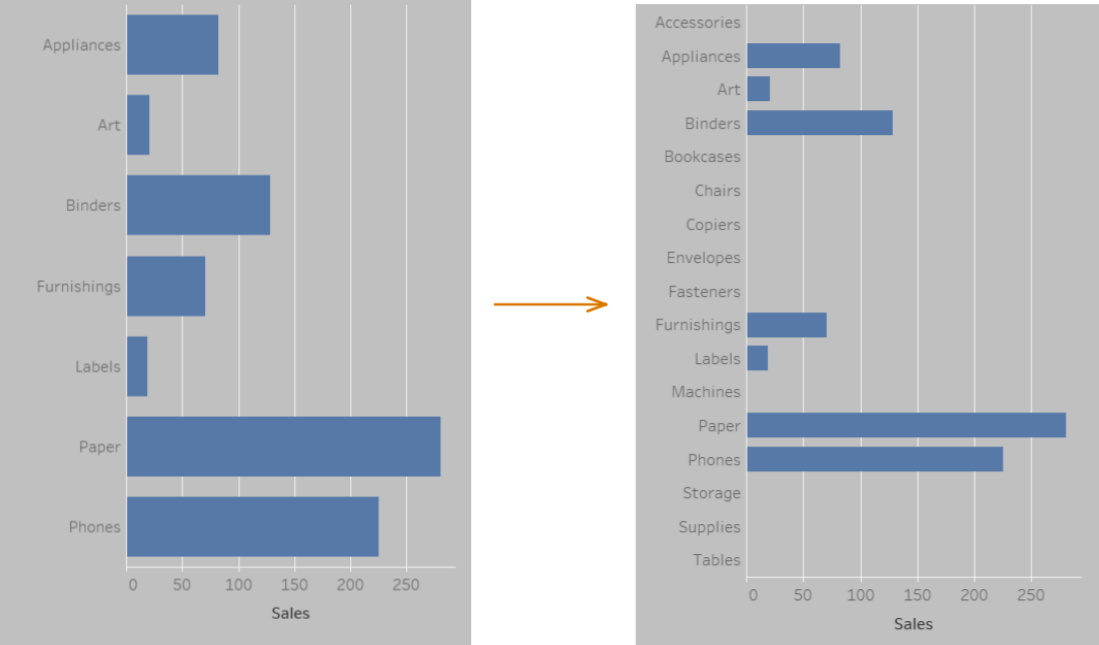
The Solution:
Simply:
- Select the sheet you want to make the changes to
- Go to Analysis Tab
- Then go to Table Layout
- And Finally Select 'Show Empty Rows/Columns' (whichever is applicable)
This works for many different chart types, so try it out! I hope it works.