


Today was the final day of dashboard week - and ultimately my final day of training. The past 4 months have been a blast, and even though it has been a very condensed schedule mixing both training and client projects, I have thorughly enjoyed it. I can't wait for what's next with my time at the Information Lab.
Today's dataset was on the TV show survivor - a long running TV show mainly running in the US, but with other shows in the franchise in Australia, New Zealand and South Africa.
I decided to spend the first hour and a half planning, while others jumped into Tableau, in order to fully understand the dataset and the direction I wanted to go with today's dashboard.
I came up with some good ideas, and drew them out using excalidraw, as well as deciding what fields and what tables I need, including the common fields to relationship between them:
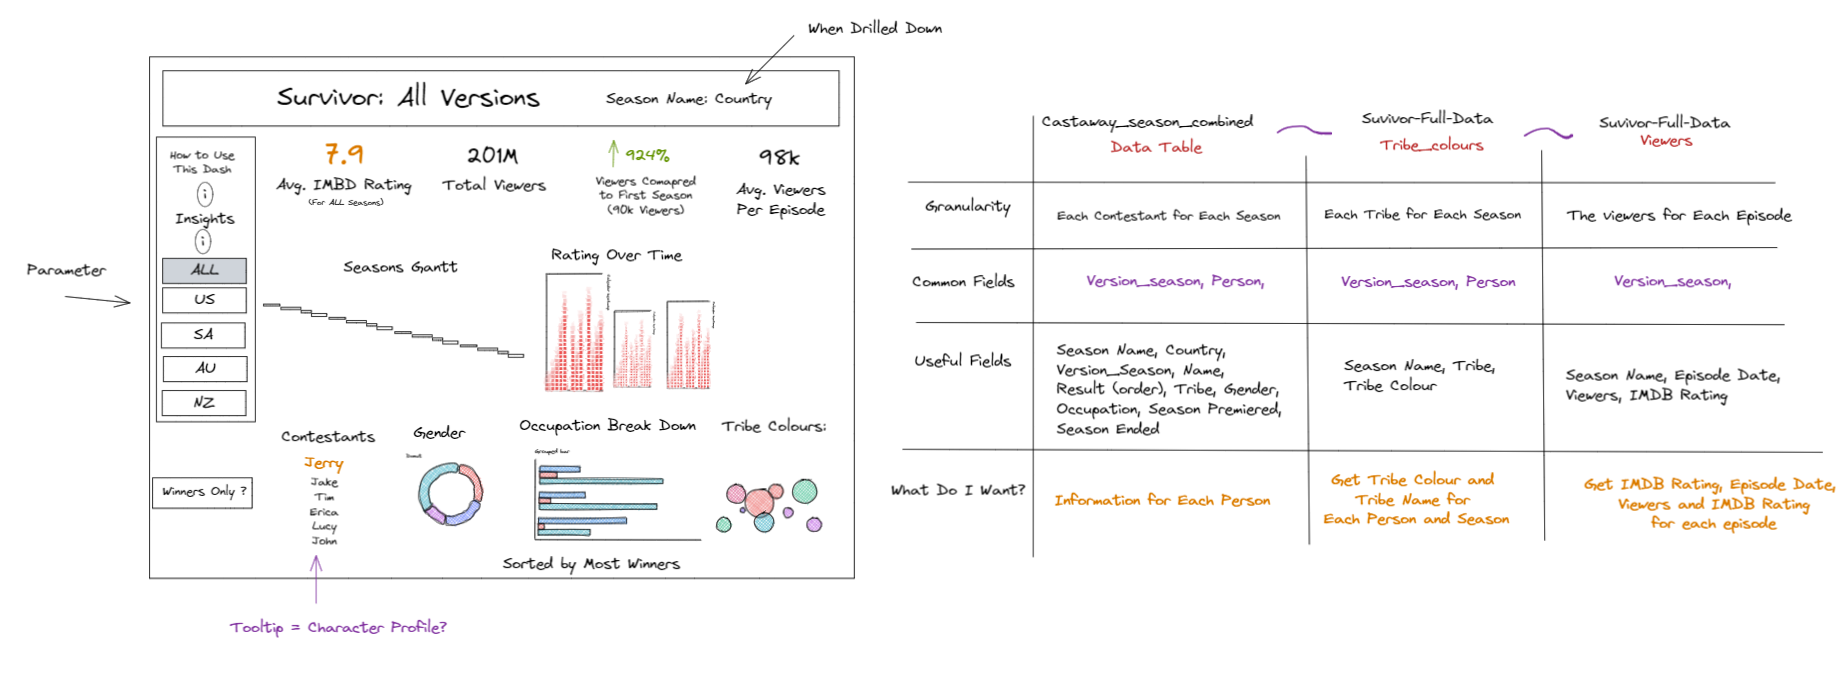
I went into Tableau Desktop expecting several setbacks, as is usually the case, however I found that the data was quite kind and there was only one or two things I was not able to include when compared to my inital thoughts.
I attempted to not use only basic chart types, as well as keeping it relatively clear, while also having that clean look that I try and make all my dashboards have.
After a very time pressured day, I was happy with the result, and ultimately happy to end training on a piece of work that I'm proud of.
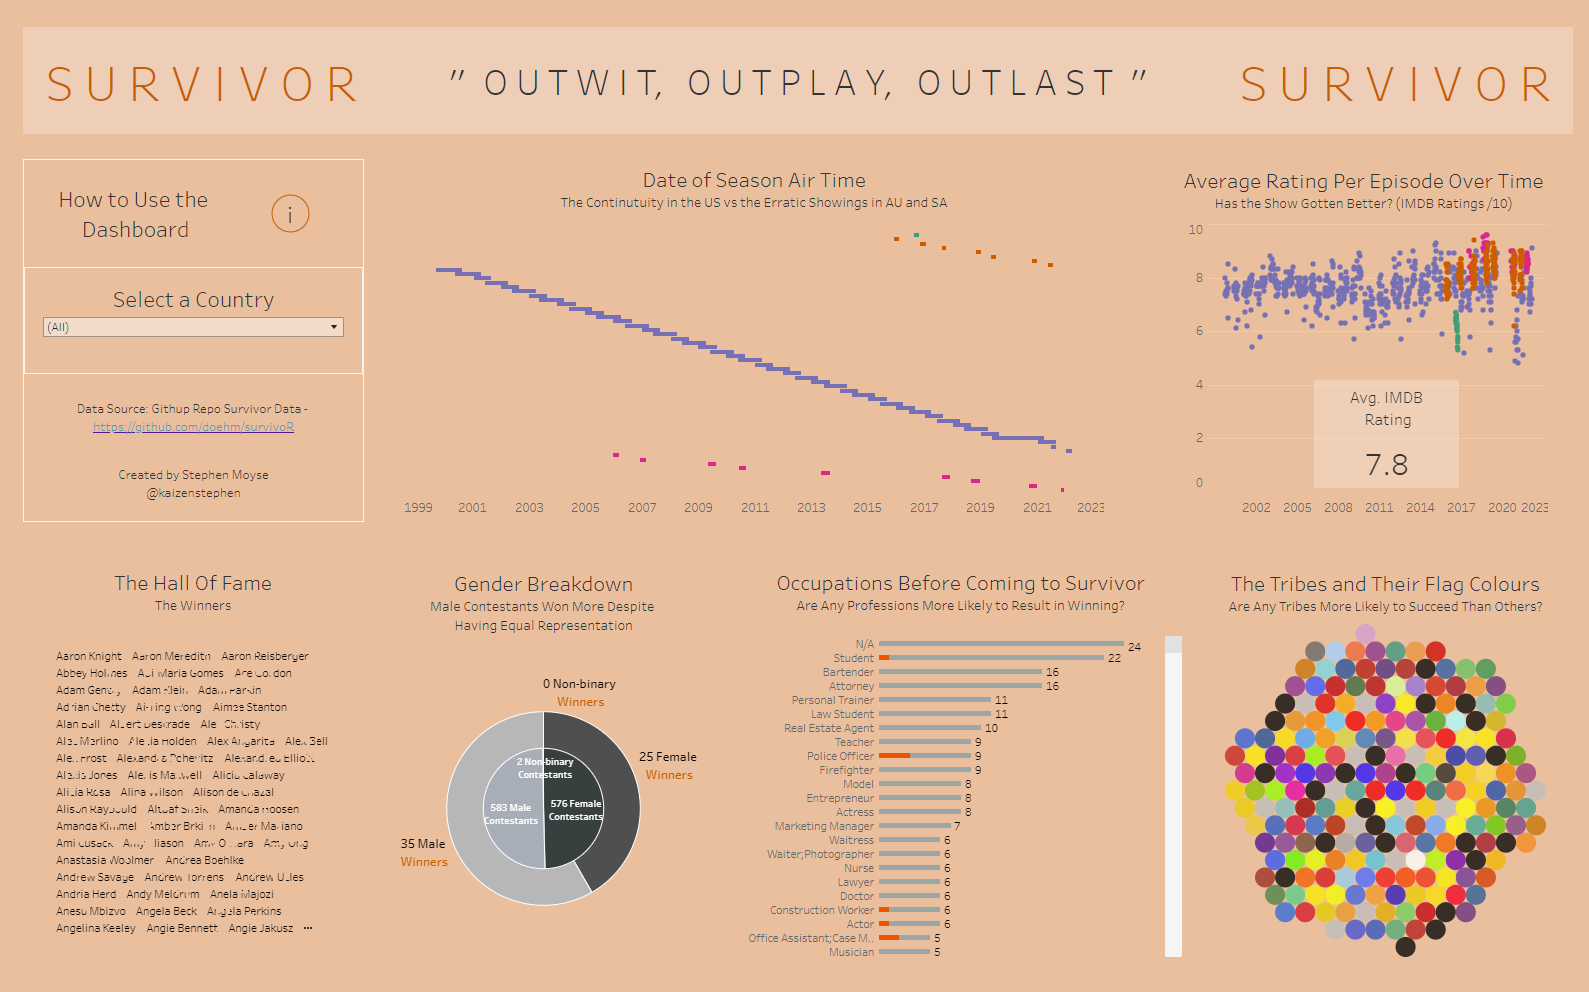
Check out my viz here