


Today we had the task of using an API to retrieve data from a website with Rick and Morty statistics. They included information about characters, episodes, as well as locations.
The API had very good documentation, and as a result it was a lot easier to follow, especially for someone who had struggled with APIs in the past.
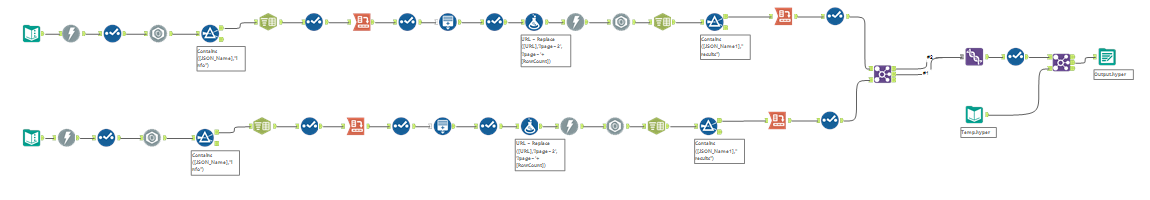
I decided to make this very long workflow, which managed to extract the data:
There was some basic cleaning and pivoting of the tables in order to get the desired results, as well as creating a count to give a value for the number of appearances each character appeared in.
Using download tools and JSON parsing, I was able to extract the information from the API and access the data. The next step was to create the dashboards, and I decided to go into the deep end of creativity, leading to some dead-ends and wasted time, but in the end a result i was ultimately quite happy with:
https://public.tableau.com/app/profile/stephen.moyse/viz/RickandMortyDashboard/EntryPage?publish=yes