


If you have a relatively clean dataset and simply plan to make a map, you might be surprised at the suggestion to use Alteryx to further expand your spatial assets. The reality is thatAlteryx stands out across all tools for its ability to handle complexity in spatial data. While Tableau and Power BI can both read and visualize spatial data, Alteryx allows you to create spatial assets and substantiate analysis.
Firstly, what is spatial data?
Spatial data is any data that relates to a physical location on the earth's surface. Spatial data shows up in more places than you'd expect. For example, zip codes are spatial data. So are rivers, sales territories, delivery routes, store addresses, and property boundaries. If it can be pinned to a place, it can be considered spatial data.
Certain spatial data - like the zip code example - are stored as string data, but on the backend, can be registered for their location. To recognize a spatial data field in Tableau, look for the below icon:

The Four Types of Spatial Data
Spatial data isn't one-size-fits-all. It comes in four basic shapes:
- Points: a single location. One lat/long pair. A store, a customer, a delivery stop.
- Lines: two points connected. The straight-line distance between an origin and a destination.
- Polylines: multiple points connected in sequence. Think of a delivery route or a bus route that hits several stops in order. Tableau is not able to create this data type.
- Polygons: a closed shape made of points. Sales territories, zip code boundaries, service areas.
Each type unlocks different kinds of analysis, and knowing which one you're working with (or which one you need to build) is step one.
Why You Should Use Alteryx to Handle Spatial Data
You can plot a point on a map in Tableau. You can plot a point on a map in Tableau. What you can't do is build more complex spatial objects, like polylines or polygons, from scratch. That's where Alteryx comes in.
1. You can build polylines
Tableau can plot points and draw paths between them if you already have the sequence figured out. But building an actual polyline object, one that represents a real path like a bus route, isn't something Tableau can do natively.
Alteryx can. Feed it a set of points with a defined order, and it builds the polyline for you.
Use case: a transit agency wants to visualize bus routes. Each stop is a point. Alteryx builds the polyline connecting them in the correct sequence, and that polyline becomes the actual route Tableau displays.
2. You can calculate spatial relationships
Alteryx has built-in tools for the math that spatial analysis actually requires: distance between points, midpoints, drive-time radii, which points fall inside which polygons. These aren't things you eyeball on a map. They're calculations, and Alteryx is built to run them.
3. Performance
Spatial data is heavy. Polygons especially can carry a lot of coordinate detail, and rendering or calculating against that data live in a dashboard slows things down fast.
Doing the spatial prep in Alteryx, before the data ever hits Tableau, means the heavy lifting happens once, offline, instead of every time someone opens the dashboard.
This is also where spatial joins come in. Instead of joining tables on a shared ID, a spatial join matches records based on location, like finding which polygon a point falls inside. Alteryx can run that join in the prep stage, so by the time the data lands in Tableau, the relationship is already resolved.
What You Need to Get Started
Before building anything spatial, you need two things in your data:
- Latitude and longitude for every point you're working with. This is the foundation. Without it, there's no spatial object to build.
- Optional: A sequence field, if you're building polylines or sequential polygons. Alteryx needs to know the order points connect in, whether that's stop 1, stop 2, stop 3 on a bus route, or leg 1, leg 2 on a delivery path.
Get those two right and you're ready to start building.
Typical First Steps to a Spatial Alteryx Flow
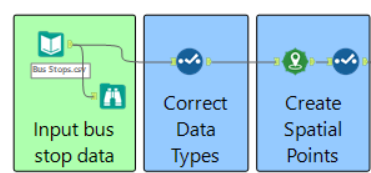
- Select Tool: Confirm your Latitude and Longitude are in the right data type format. Lat/Long may be stored as a string - confirm it is stored as a Double or another float type. If you have a sequence field, confirm its stored as an integer type.
- Create Point Tool: Drag in your Lat/Long to this tool to create the spatial data type. This generates one point for every row. The new field will look like this:
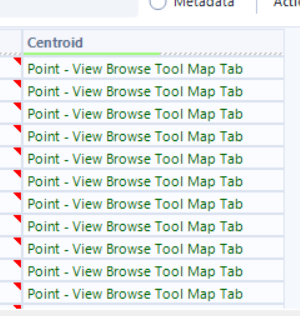
If you connect the browse tool, a map will be generated.
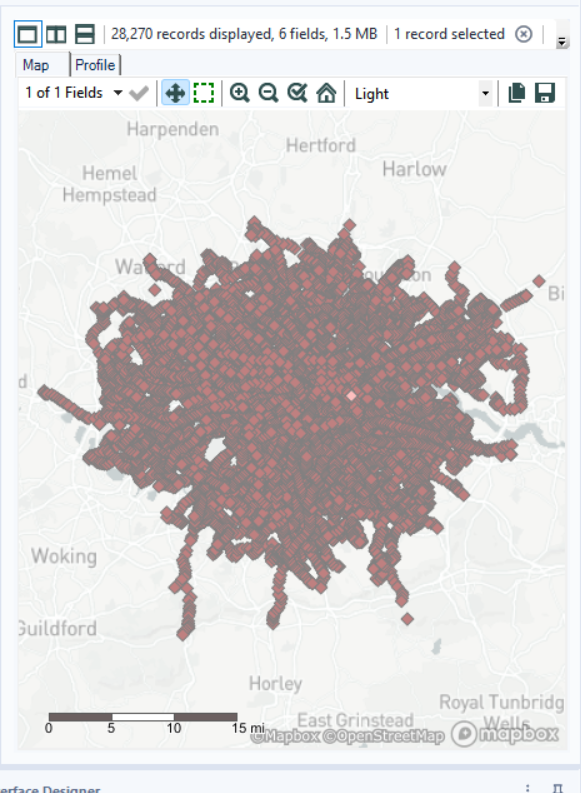
- Select Tool: As seen in the screenshot above, Alteryx uses the same name for all spatial fields. Best practices is to use a select tool after each spatial tool to rename it and have a clean dataset.
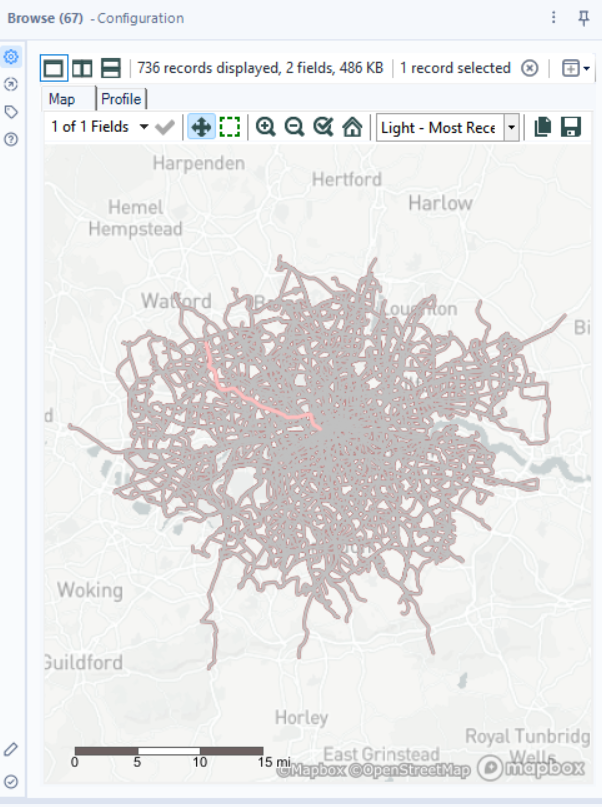
- Moving forward from this step, if you have a sequence field, you can drag the Poly-Build Tool over to create either polygons or polylines. Once we insert the routes, the above map of bus stops in London will look like this:
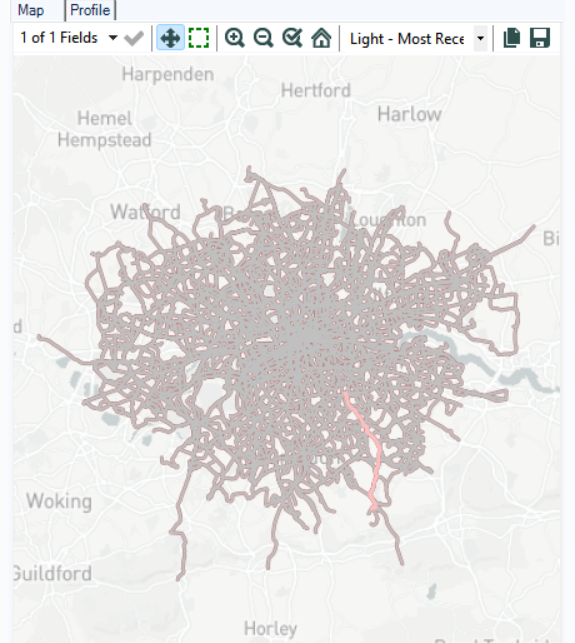
- One important thing to note about this function is that once you create polylines or polygons, you're essentially summarizing your data. Consider the level of detail you need your visualization to be on before you do this.
Wrapping Up
At this point, a table of individual bus stops has become a single polyline representing the full route, something Tableau can't build on its own. That polyline is now ready to bring into Tableau, where it'll render as a clean route on the map instead of a scatter of disconnected points.
What's Next
This post covers the what and why of spatial data in Alteryx, plus the first few steps to get a spatial workflow started. The next one goes deeper: a full walkthrough building out a spatial workflow end to end, from raw lat/long data to a finished spatial object ready to drop into Tableau.