Ever wanted to know which workbook tabs are viewed on Tableau Server? In this post I’ll go through a PostgresSQL data dashboard template I created last week.
It was Tableau Server last week at the Data School, with our very own award winning Tableau Server guru Jonathan MacDonald. We learnt a lot about Tableau Server and had a play around with some PostgresSQL data. PostgresSQL allows you to track and analyse almost any behaviour within your server.
Tableau has some built in trackers, to enable you to start looking at how people are using the server (Charlie has covered how to find these). But what if these don’t cover what you wanted to find out? What if you want to dig a little deeper?
This is where PostgreSQL comes in. This is basically the data that sits behind these reports and contains almost anything you’d want to know about your server.
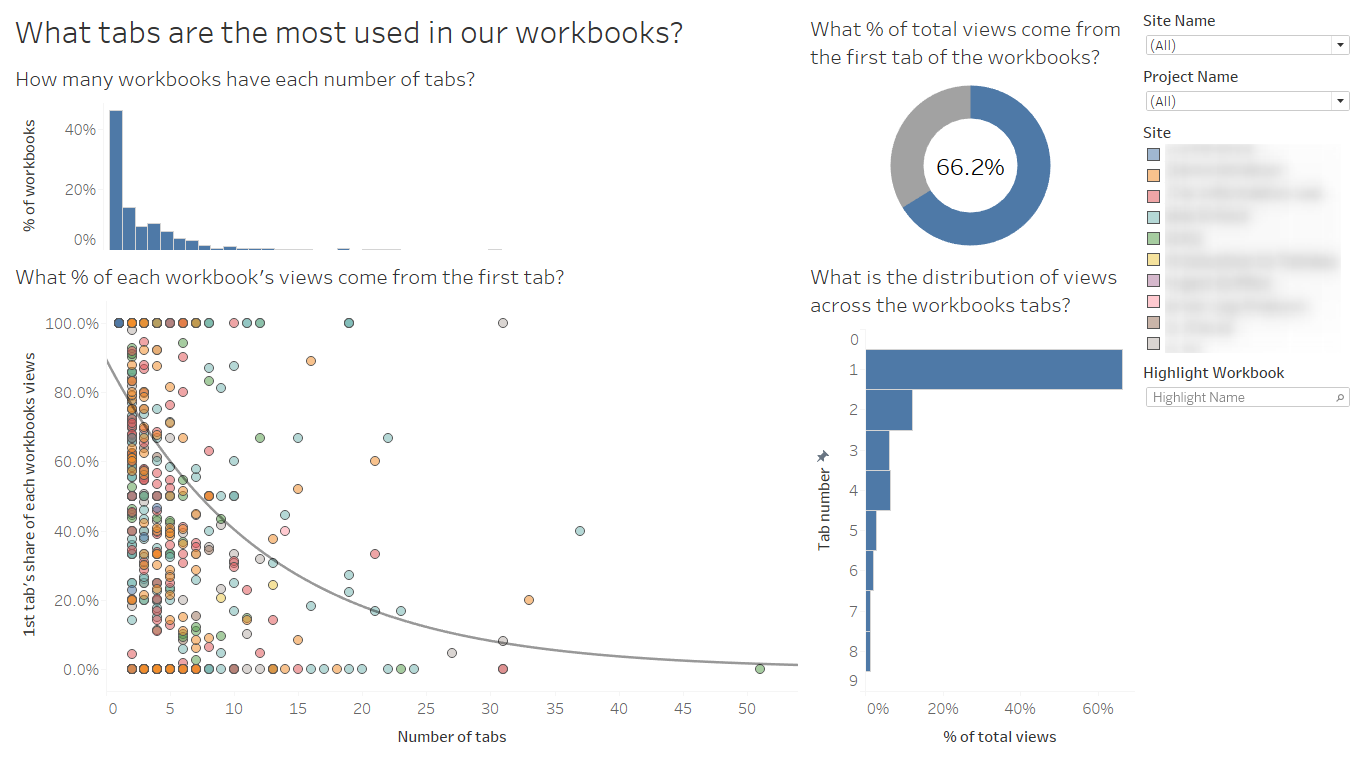
We had a go at building a number of different dashboards. The aim was to answer some of the key questions people may have about the usage of their server. I looked in to which tabs are most viewed within each workbook on the server. We had a couple of days to explore the data and produce something and I’ve included mine below.
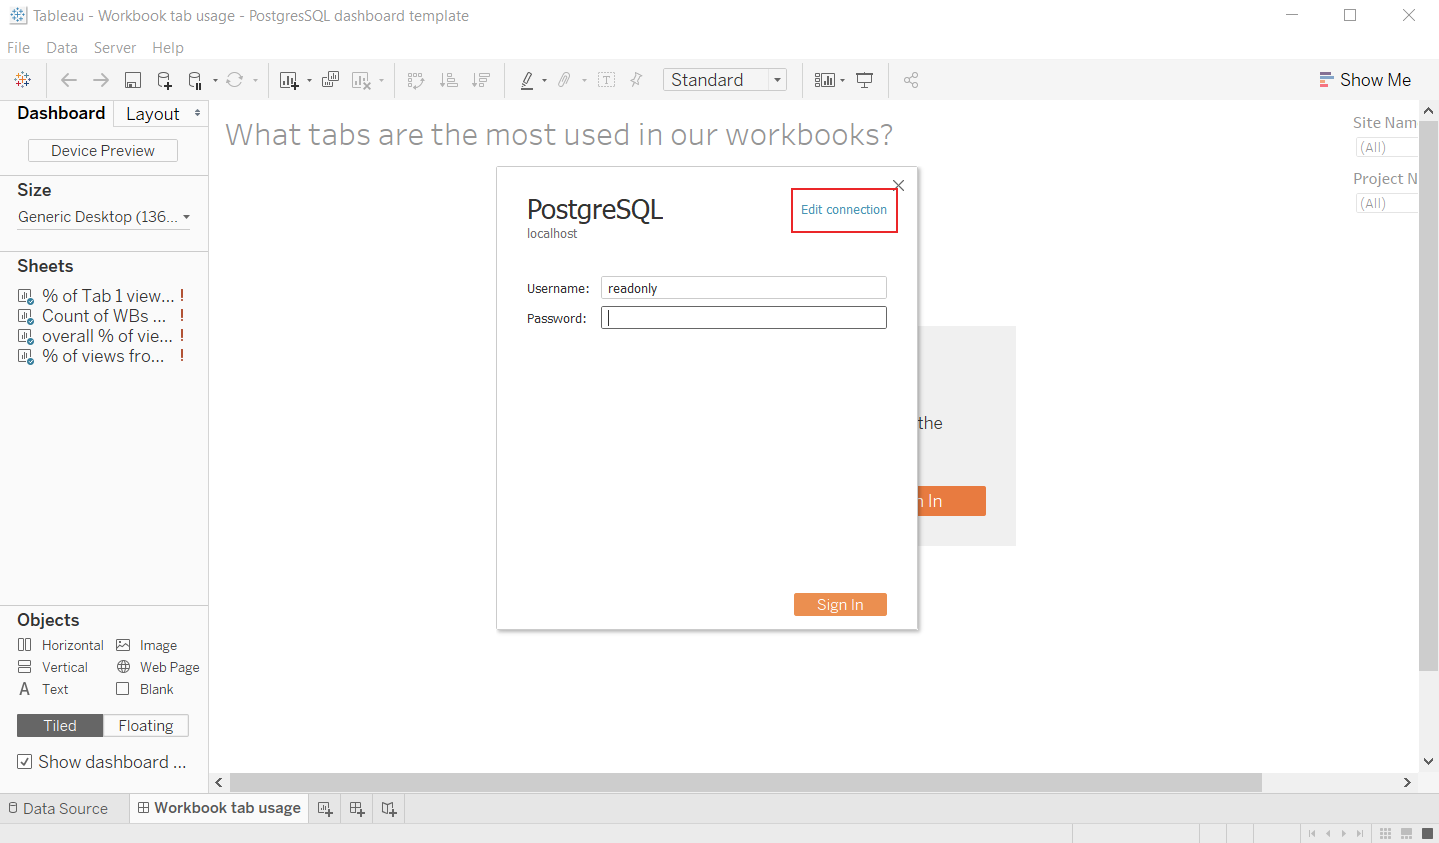
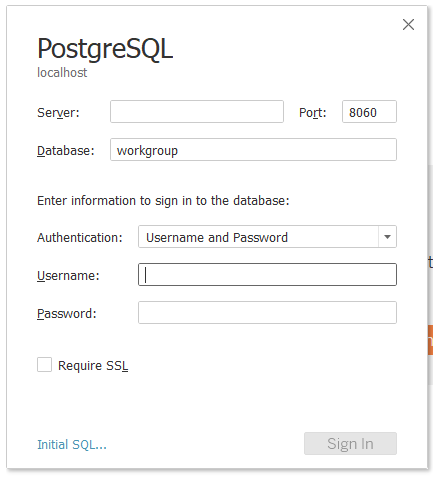
If you want to have a look at it yourself, simply click here to download the twb and connect to your PostgresSQL database.


Below is an example of what the dashboard looks like, click to download the twb.

