


Today was the fourth day of Dashboard Week and our task was to create an infographic using an endangered species API that documents declines in biodiversity throughout the world. For my infographic, I was interested in researching a marine animal, so I chose to focus on the bull shark, the only species of ocean shark that can survive in freshwater.
Before I decided on it, however, I first tried to get an understanding of what data I could get from the API. This quickly became one of my biggest blockers because the API didn't provide a lot of numerical data. Moreover, many of the API endpoints were paginated, but since I anticipated that it would take a while to run and I didn't want to risk hitting my rate limit, I decided to look for endpoints that did not return multiple pages. As a result, I decided to focus on a single animal, the bull shark.
Afterwards, I worked extensively in Alteryx to parse the API data. I soon ran into another blocker, which was the fact that many of the fields had to be unnested, and they all had different key-value pairs at varying levels of detail. To resolve this, I pivoted my data to combine the data into a single column, and extracted the most important values from each using the Formula tool.
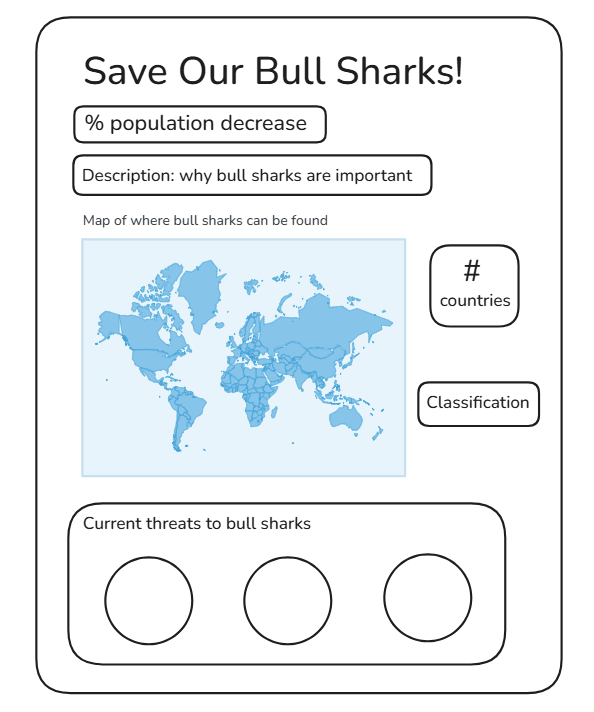
Eventually, I was able to extract the data that I deemed most important, but I ended up using just a small portion of it because I wanted to provide a high-level overview with the most important insights. Since the API doesn't allow its data to be published, here's a sketch of what my final product looked like:
Overall, I really enjoyed today's task because although the data was limited, the format of an infographic allowed for a lot of creative freedom. The main lesson I learned was that if the scope of my problem is too broad, I should try to narrow it down to what's feasible. I also learned that narrowing my scope doesn't necessarily mean I have to compromise on my output, but rather that I should make the most of what I can accomplish.