Introduction
For Learn What the Data School Learns (An event where we teach you a bit of what we learn at the Data School), I had the pleasure of teaching participants about the Transpose and Cross Tab tools in Alteryx. As such, I decided to do a basic introduction of both tools on our Data School Blog as well. This is part 1 focusing on Transpose. Click here to go to the post on Cross Tab.
Transpose and Cross Tab are both transformation tools; the orange tools in your tool palette on Alteryx. They allow us to reshape the structure of our data and, as such, are probably the trickiest to fully understand and utilize properly. (They were definitely the hardest tools to fully understand when I took the Alteryx Core Examination.)
Diving into Transpose
The Transpose Tool allows us to transform columns into rows. As such, you will end up with more rows in your data set. Effectively, this will reshape your dataset to be more narrow.
The way I like to reason about Transpose in Alteryx is that I transpose when I would like to turn my column headers into values within a
single column. It will always convert your selected columns' headers into one column and the resulting values in the second column. The former will always be named Name, and the second will be named Value. You can always use a Select Tool to change the name of these columns.
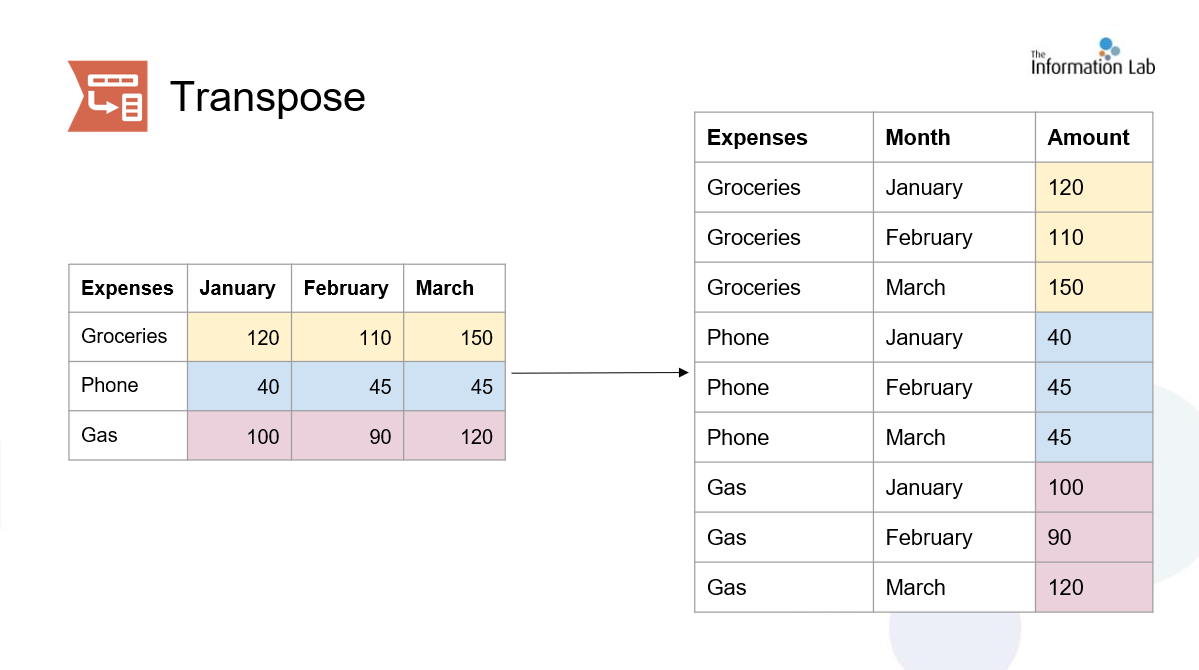
Here is what a successful transpose looks like: Note: I've already renamed the two columns from Name and Value to Month and Amount so it's easier to see the structural changes in the data.

As you can see in this example, I've transposed all the month columns. The values in my first new column were my original month column headers: January, February, and March. In the second column, I have all the original expense amount values per month.
Note that the the rows have multiplied by 3 as we originally had only three rows: one row for each expense across three columns: one per month. As such, a great way to sense check to see that the transpose was done correctly is to make sure you have the right number of records after transposing. The formula is always the number of rows originally multiplied by the number of columns being transposed.
Configuring The Transpose Tool
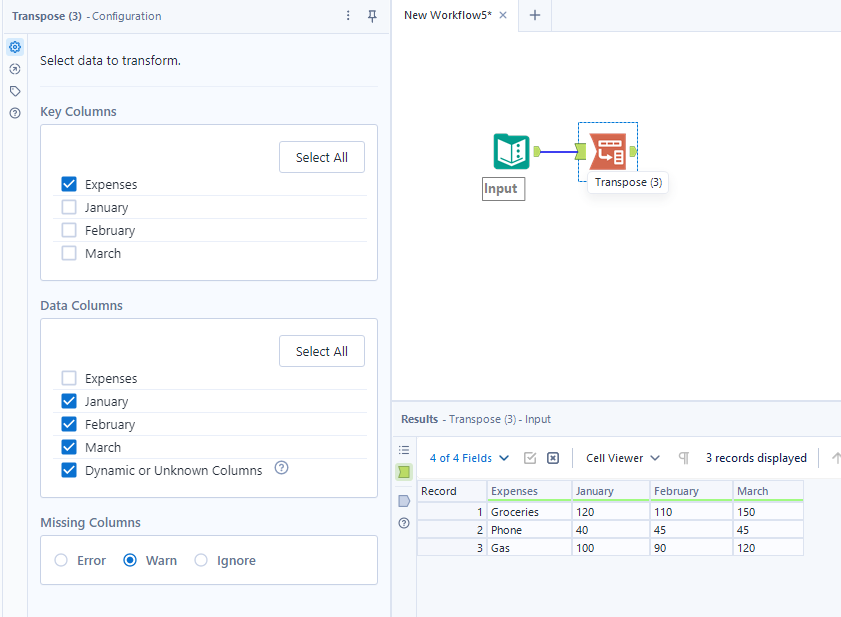
Here is what your configuration pane should look like after dragging in the tool:

There's two sections that need to be configured: Key Columns and Data Columns.
- The Key Columns section is where you select columns you want to preserve after the transpose. Notice how we still had expenses in the output in the above example. To keep that column of data, we need to tick the box next to Expenses. If that's no longer needed that you can leave that unchecked.
- The Data Columns section is where you select all the columns you want to transpose. Remember that every column selected will turn into values for the Name column. Another way to reason about it is that you want to group and transpose all the similar columns together. All three of my columns were months and that's why I wanted to transpose them together.
Transpose is definitely the easier of the two to reason about. With practice you'll start to easily recognize scenarios when you want to transpose. And that's all for part 1! To read part 2 click here!
