Introduction
Welcome to part 2 of my blog post on Transpose vs. Cross Tab. In the first part, I gave a brief introduction to both tools and dove deeper into Transpose. In this post, we'll take a closer look at Cross Tab. If you haven't read part 1 yet and would like to click here.
Diving into Cross Tab
The Transpose Tool allows us to transform rows into columns. As such, you will end up with more columns in your data set. Effectively, this will reshape your dataset to be wider.
The way I like to reason about Cross Tab in Alteryx is that I Cross Tab when I would like to turn all the values in one of my columns into columns of their own. However, what makes Cross Tab more difficult to reason about is the fact that you need to think about how the values will aggregate. We'll see what this means in a second.
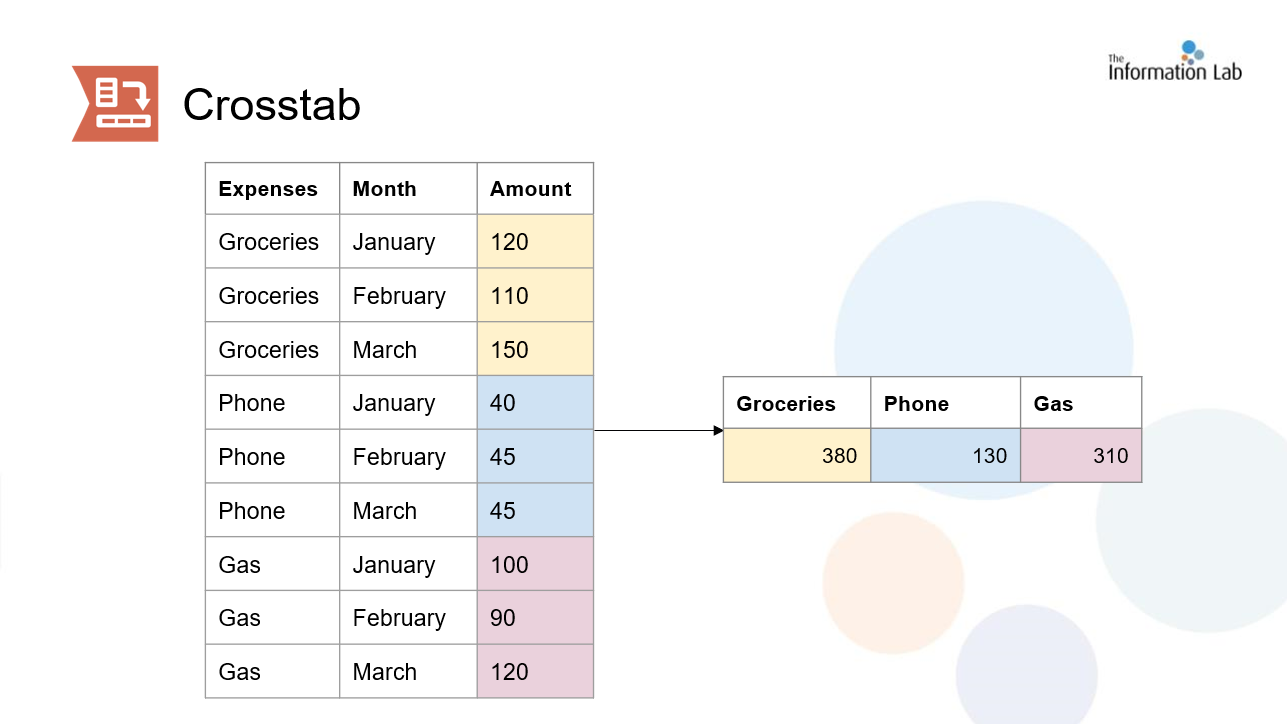
Let's take a look at a successful Cross Tab:

As you can see in this example, I've cross tabbed the Expenses column. The three new columns we got were all the values that existed in that column: Groceries, Phone, and Gas. I also chose not to keep the month column to illustrate a point. (We didn't get to configuring the Cross Tab tool yet, but you can also think of this as the Key Column section of the Transpose tool. Because I didn't select the Month column, we lose this column of data in the results.)
So, you may have noticed that all the values were summed up. This is what I mean by aggregation; we need to tell Alteryx how to aggregate values when cross tabbing as it needs to know what to do with multiple values that relate to the new column header. Without the month column adding an extra level of detail to our data set, Alteryx needs to know what to do with the three different values for groceries, phone, and gas. So, I told Alteryx to sum those up. There are many different aggregation methods like sum, average, count, and sum. It's important to choose the one that best fits your use case.
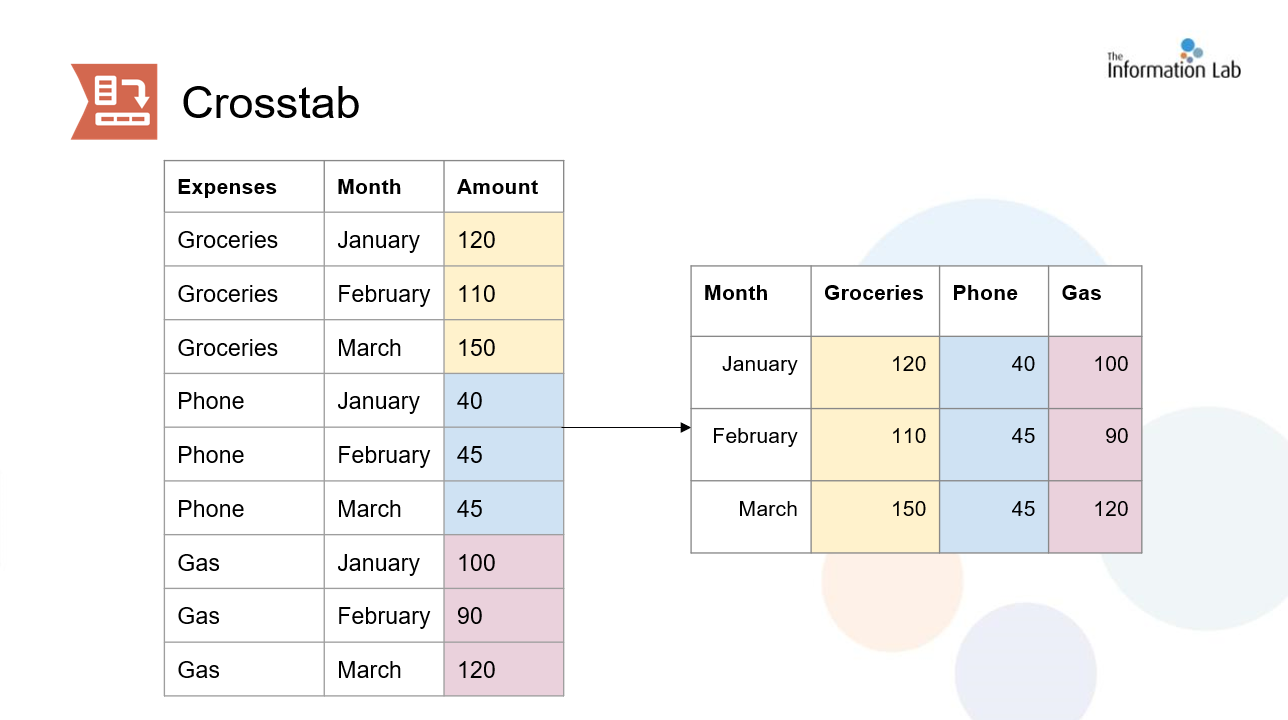
While you always need to select an aggregation method, technically your values will not always end up aggregating. Take a look at what happens in the next example when I configure the tool differently:

Like I mentioned before, I chose not to keep the month's column in the first example. But in this configuration, I did keep it. As I kept that level of detail, even though I specified sum as the aggregation method, I was able to keep the original values as there's only one value for each combination of month and expense; in other words the sum of 120 is just 120!
Configuring The Cross Tab Tool
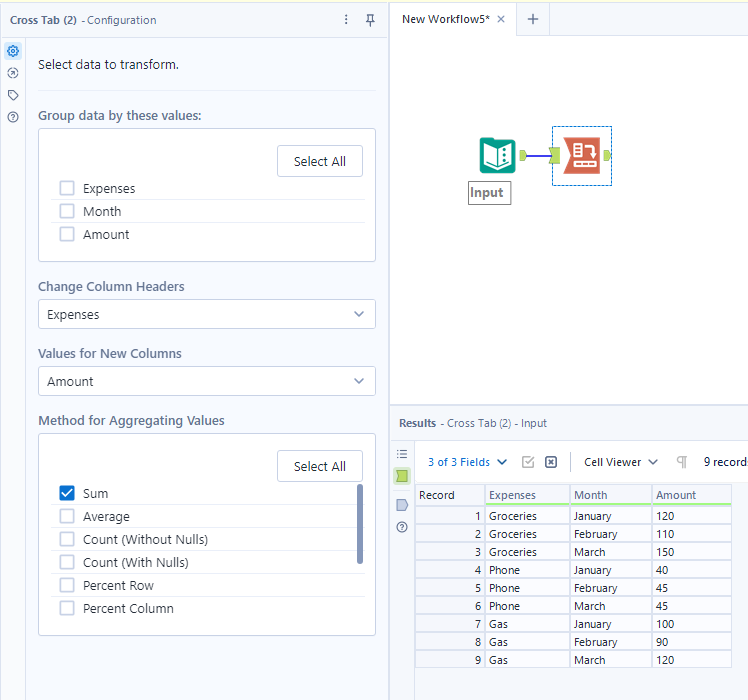
That was a lot but we're almost there! The only thing left is to examine how we actually configure the tool. This is what your configuration pane looks like when dragging and dropping in the tool:

There's four things that need to be configured here: Grouping data, Change Column Headers, Values for New Columns, and Method for Aggregating Values.
- Like I mentioned prior, selecting which columns to group by is essentially selecting which columns you'd like to keep.
- In the change column headers, you want to select the column with the values you'd like to convert to column headers.
- In the values for new columns, you're selecting the column that contains the values for each of your new columns.
- Remember, you always need to select a method of aggregation even if you know for a fact your values will be distinct and won't be aggregated. In the method for aggregating values, select how you want your values to be aggregated. Note: Depending on the data type, your options for methods of aggregation will be different. You can't average strings!
This was a lot for Cross Tab and I think it's because Cross Tab honestly is the harder tool of the two. But once you've gotten to practice with both tools a little bit it'll definitely come more naturally to you when and how to use them. As a last note, Transpose and Cross Tab are inverses of each other. In other words, you can always undo a Transpose with a Cross Tab and undo a Cross Tab with a Transpose. And that's all for now! Happy Alteryxing!
