


To understand what Z-score does, we need to first understand some basic statistic knowledge - normal distribution and standard score.
When we say distribution of a sample, we are referring the shape of the data in the frequency graph; while 'normal distribution' is illustrated as a bell-shaped curve as show below.
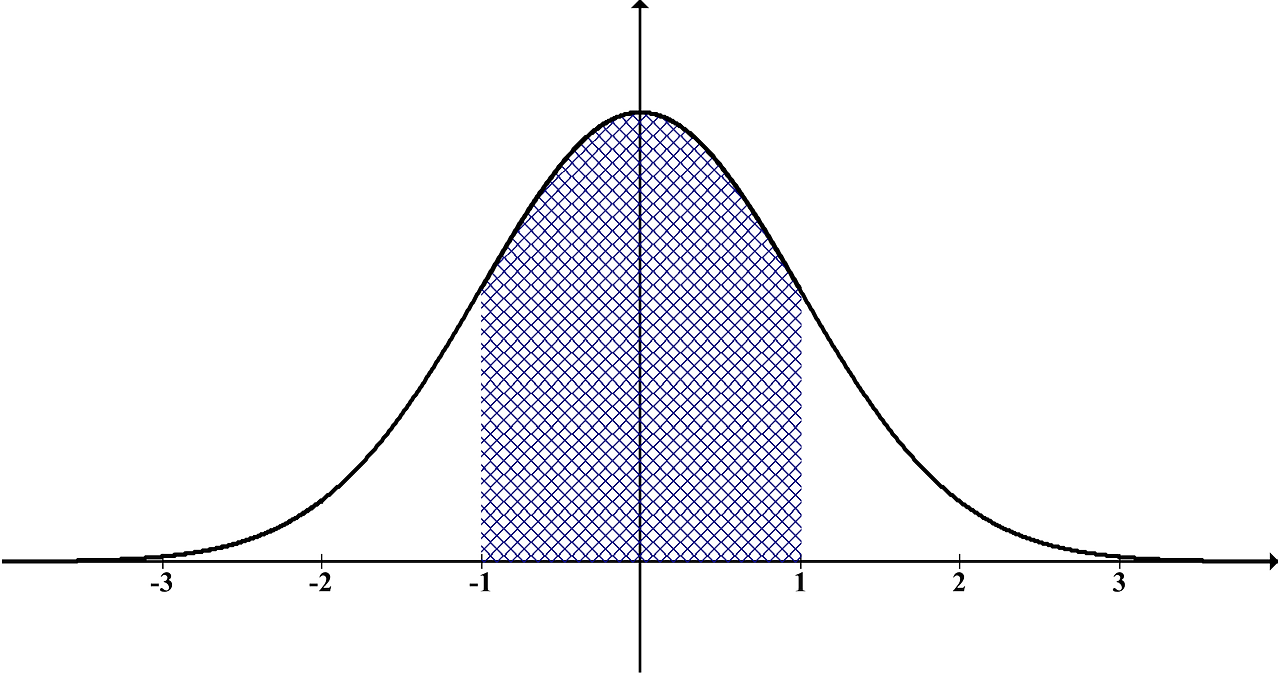
The height of the curve indicates the frequency of the data observed around the x-value, which also implies the probability of a data that would occur around that x-value. The x-value could be any numeric value, for which we transform this into "standard deviation (S.D.)" via an equation notated by "σ". This standard deviation shows how data spread from the mean. For example, in the case of normal distribution,
- +1 S.D. mean that data was higher than 34.1% of data above the mean.
- +2 S.D. mean that data was higher than 47.7%(34.1%+13.6%) of data above the mean.

Sometimes we want to compare different samples. Let's say we want to the compare the profit across the product category.
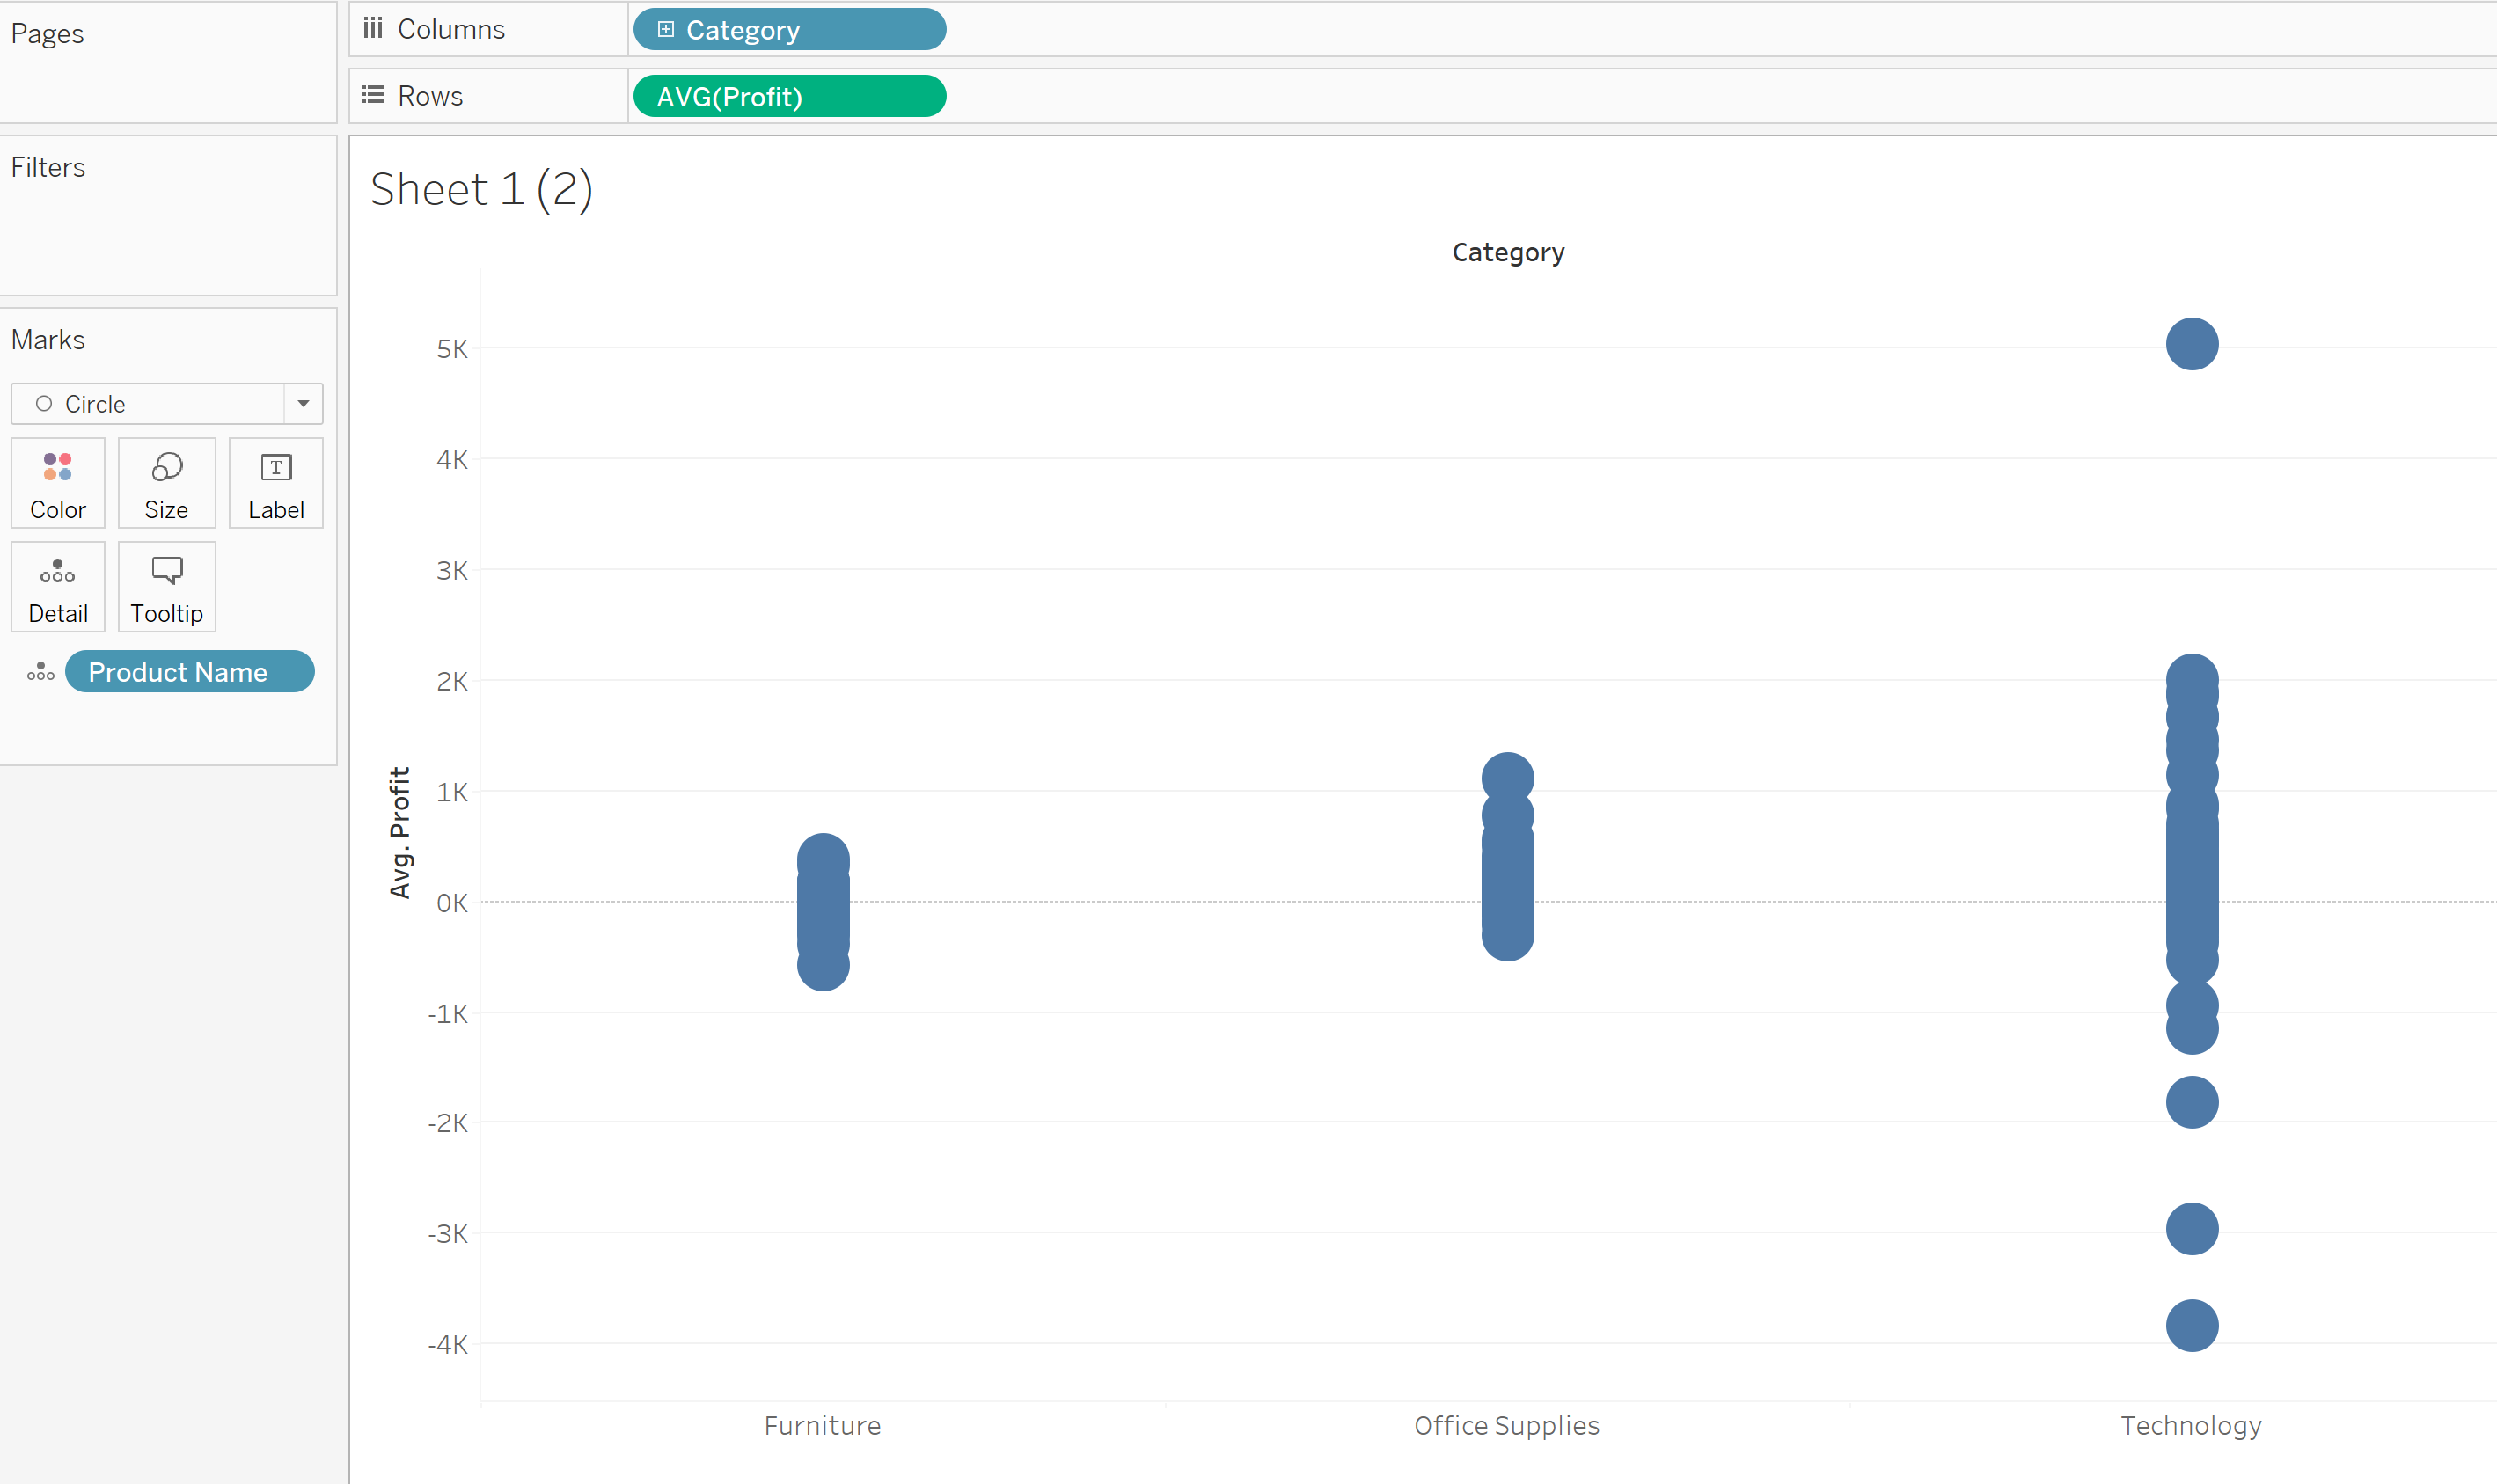
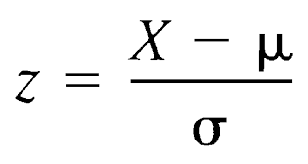
One pitfall here is that technology product often more expensive than office supplies and furniture. We need to ask "How well do the products performed in term of probability within their own category but the measure is standardized so that we can compare across the category". Here is the reason why we need Z-score. Z-score measures how many standard deviation does a data point deviated from the average. The following is the calculation of the Z-score, where X is a data point, μ is the mean of the sample and σ is the standard deviation. Because this calculation standardize the each value in a comparable manner, Z-score is also known as standardized scores.
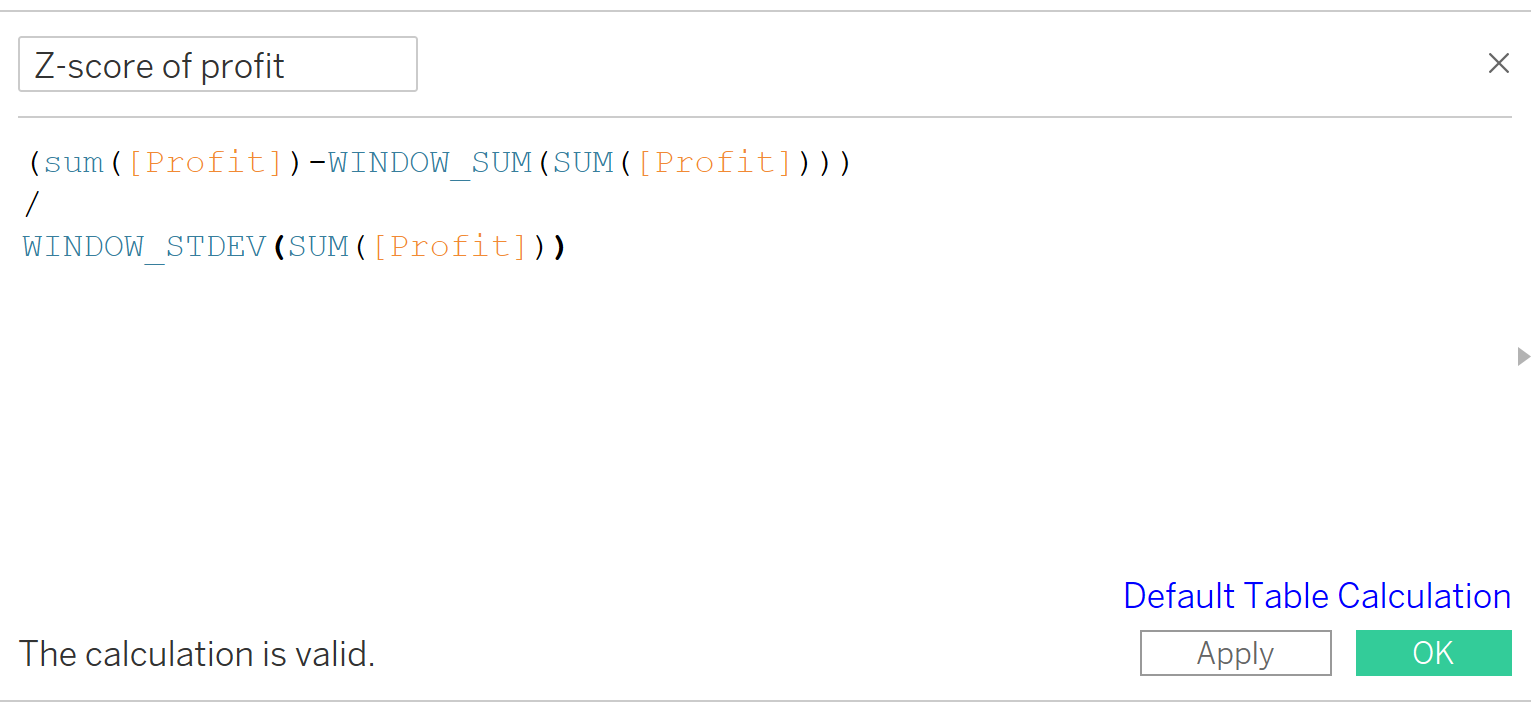
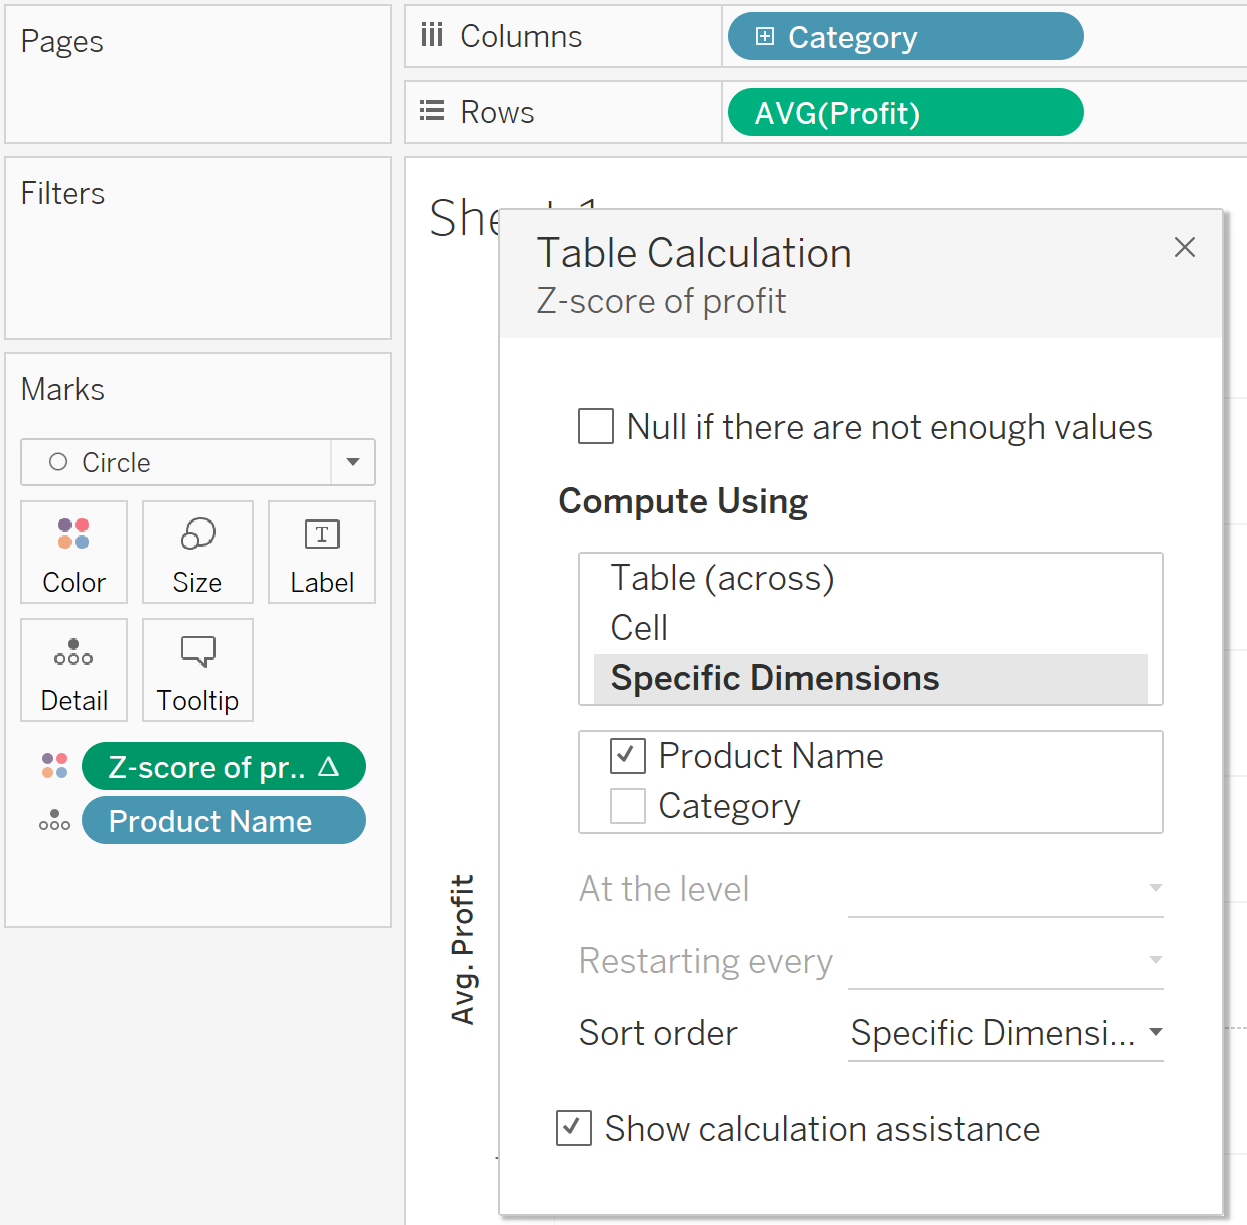
In Tableau you can do the calculation as follows, then put the calculation into color mark and select the calculate using all the products (checked the product name) and restart at every category (unchecked the category).
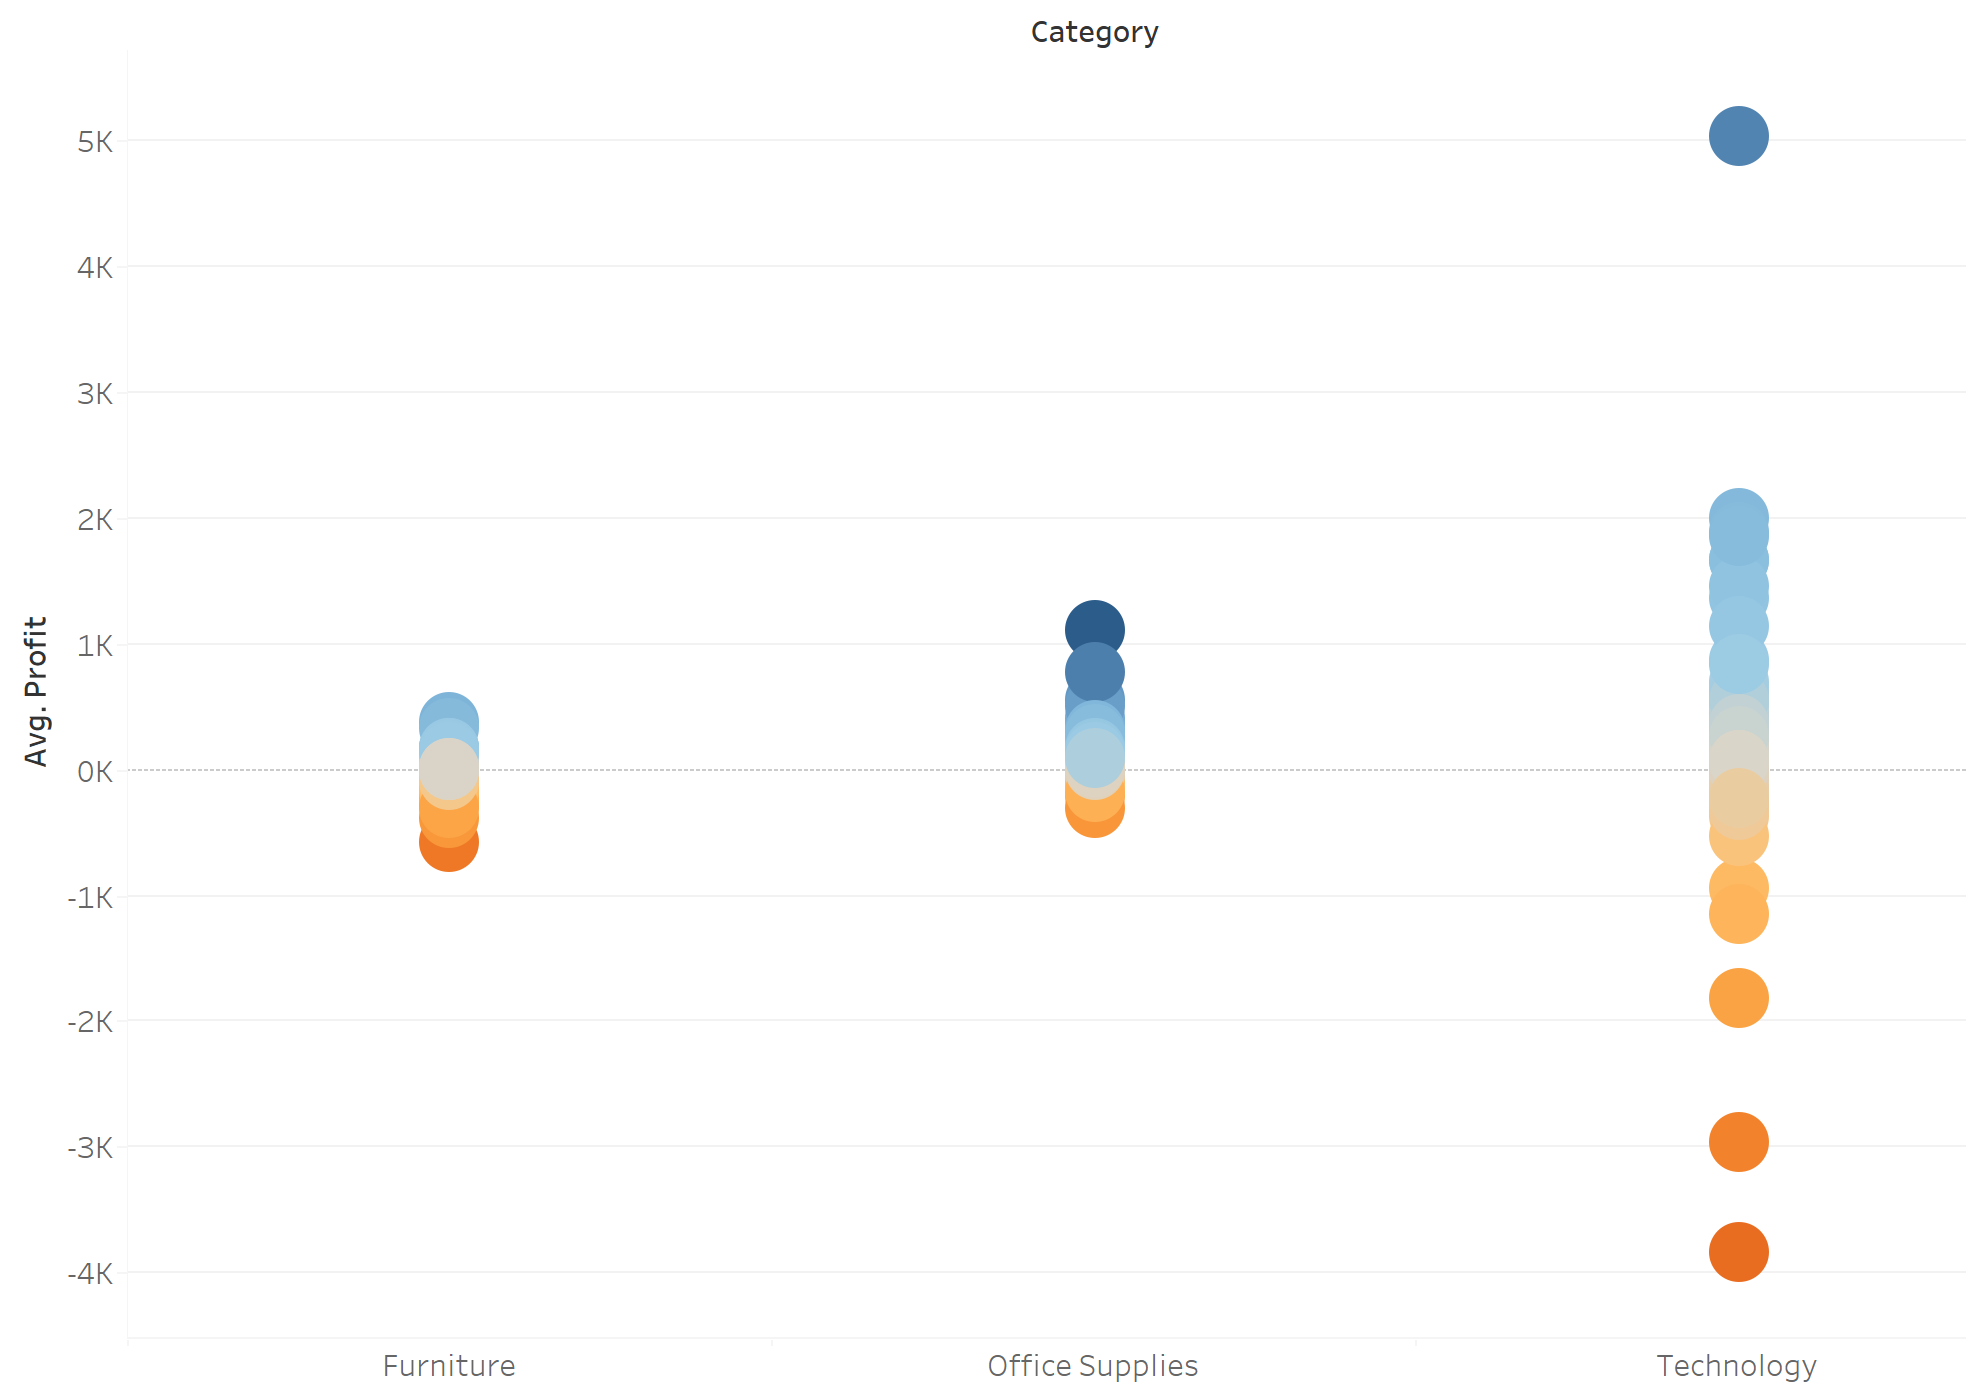
Finally you will see something like this, while the blue and orange indicated the positive and negative of Z-score respectively. As you can see, although the best product of the technology made a huge profit, it just performed fairly well within the technology category. Compared it the best product of office supplies, although it did not make a huge profit as the one in technology category did, its performance is a super-star and a very special outlier within office supplies.
By doing this, we don't judge the performance by the value itself with a unfair comparison, but we compare how well a data point did within its distribution.