


Today I would like to share how to make the chart below, where you can click the category (here is the region) to drill down all the data points in that selected category.
- Put Region on columns and average Sales on rows

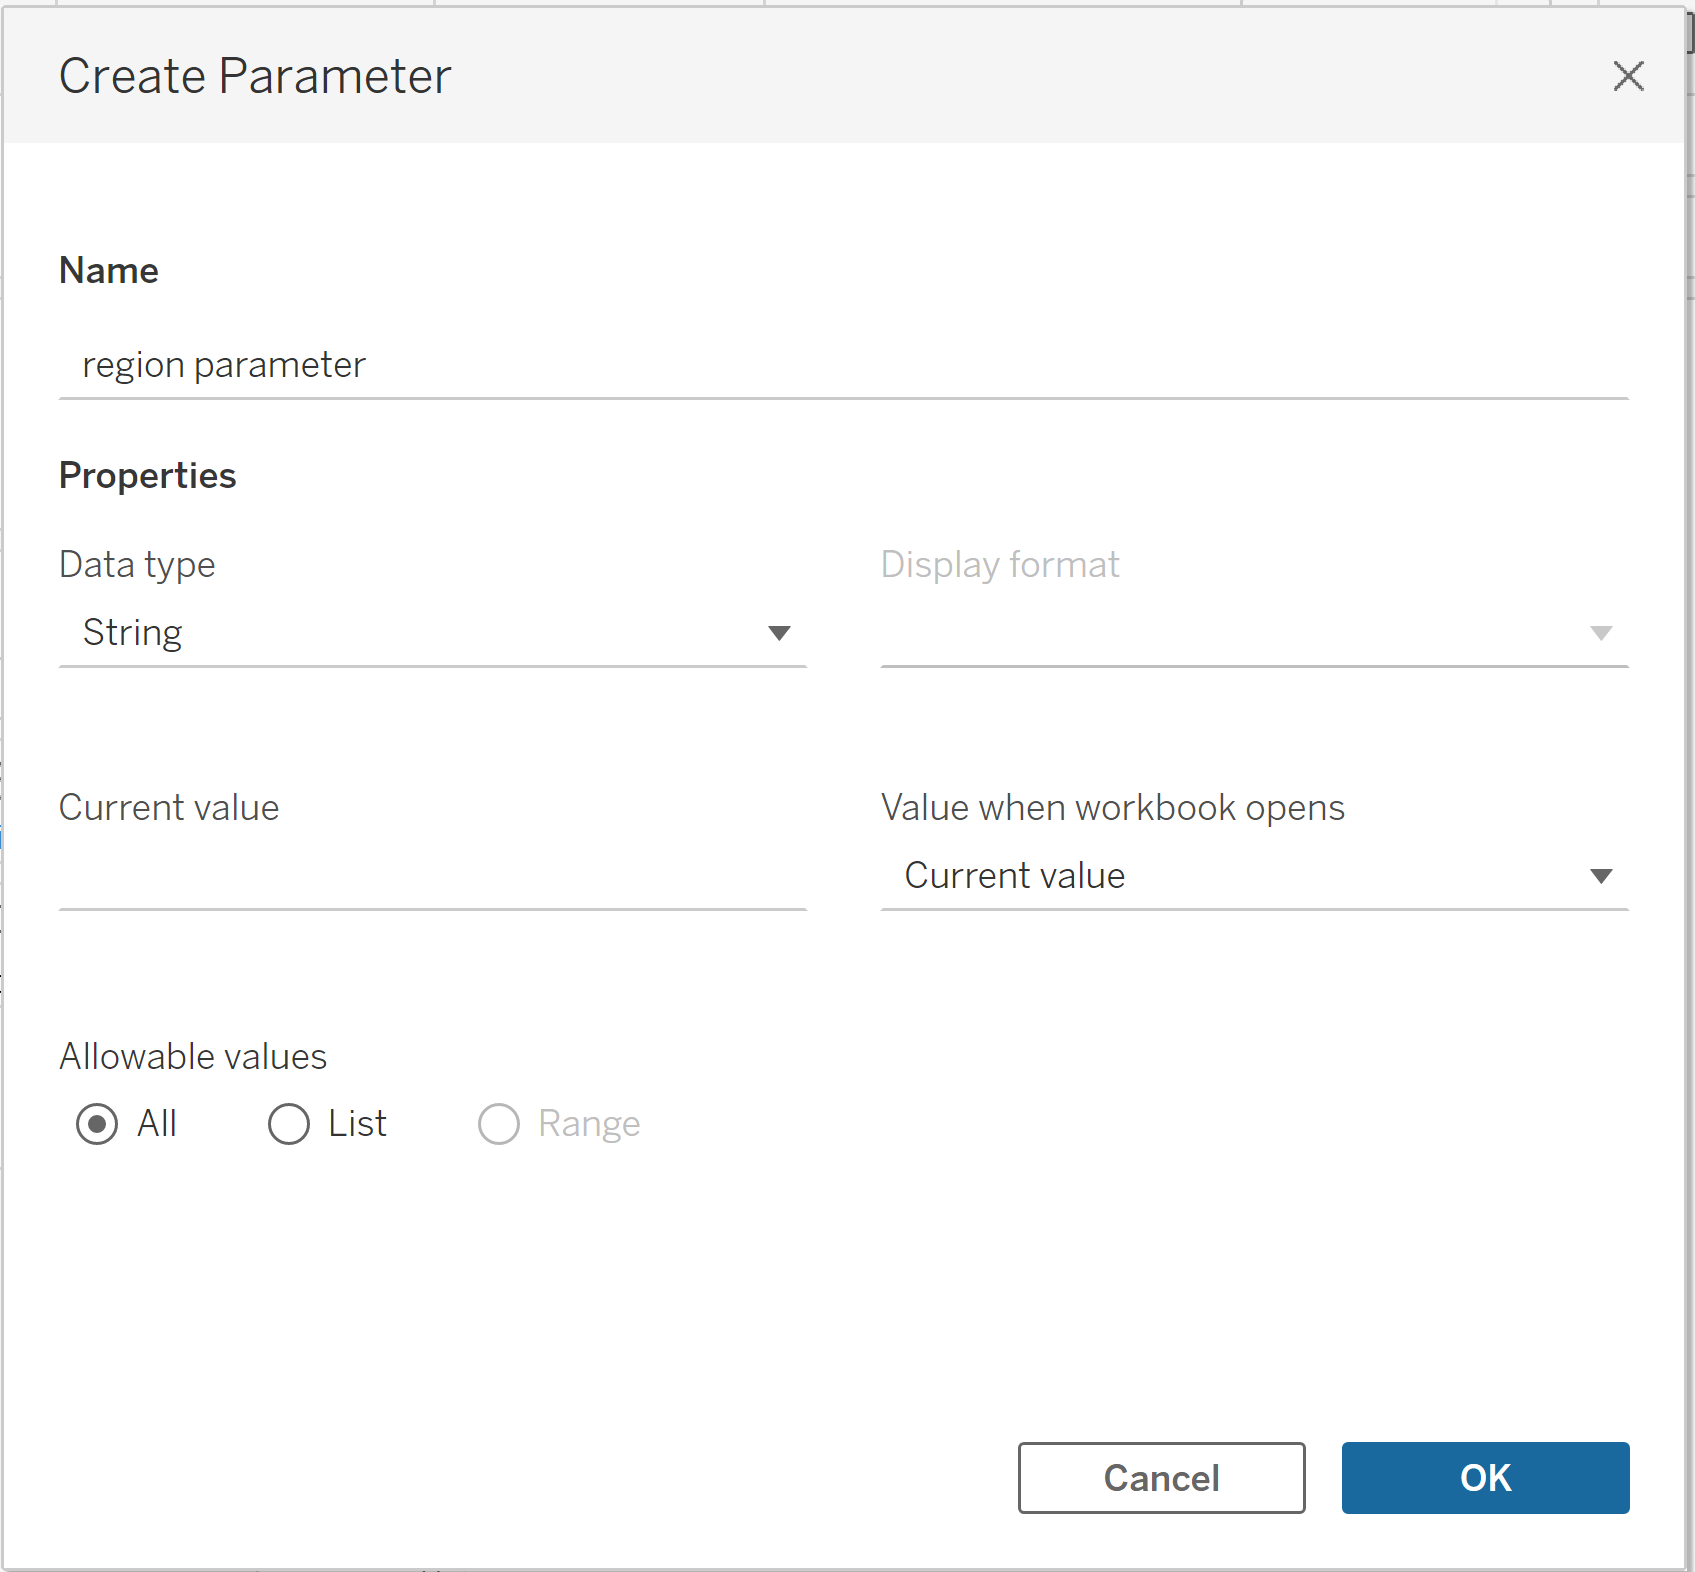
2. Create a Parameter that will be changed by our action. The data type would be String and the Current value is anything (it will be changed anyway so doesn't matter, I left it blank here)
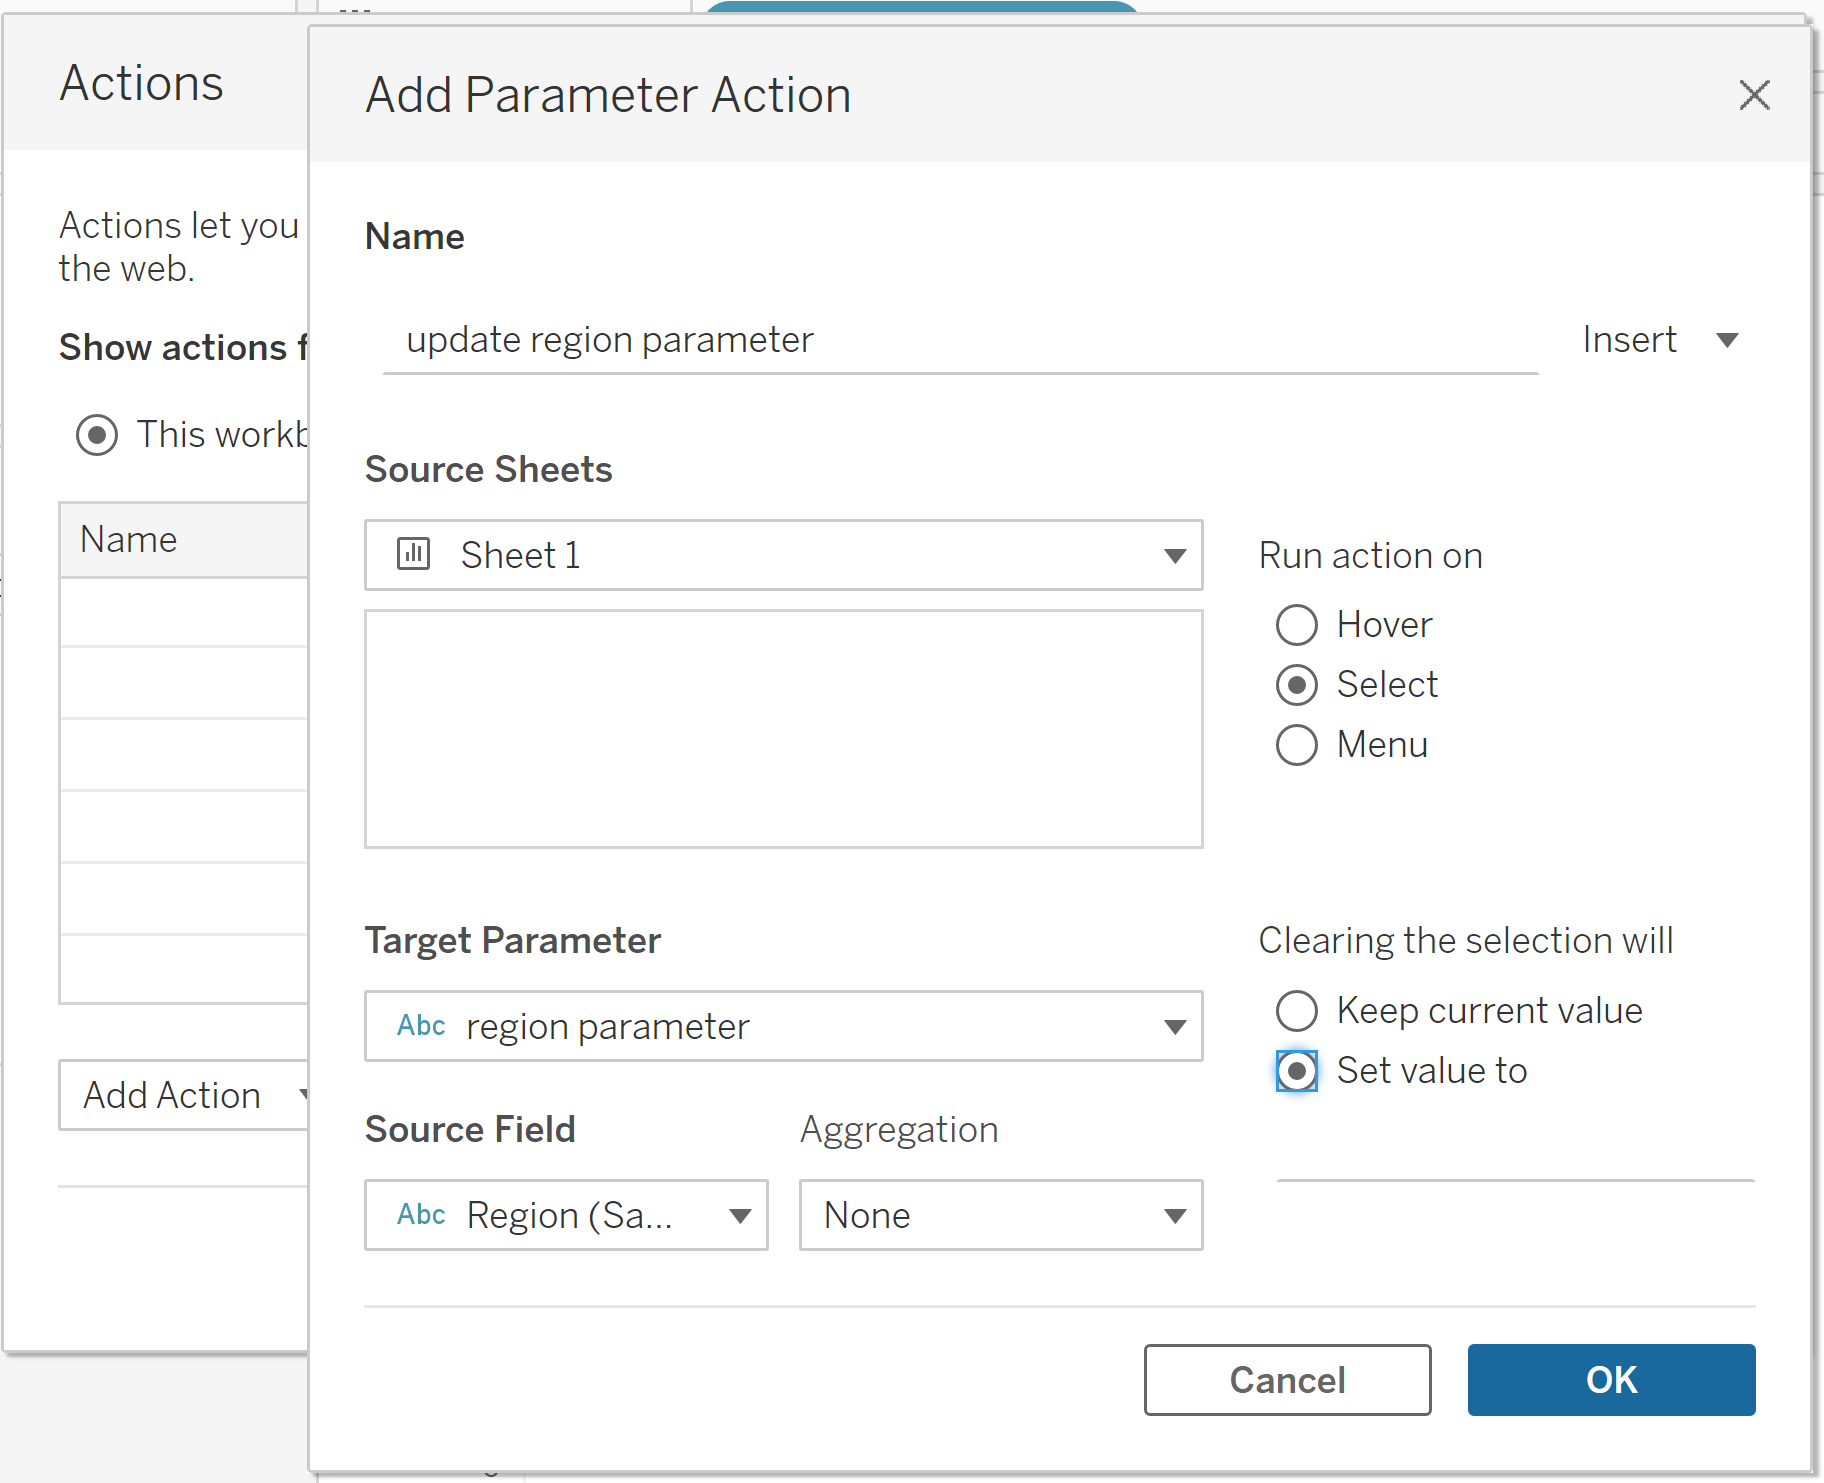
3. Create a parameter action that changes the region parameter (target parameter) using region (source field). Clearing the selection will set the value to 'blank'.
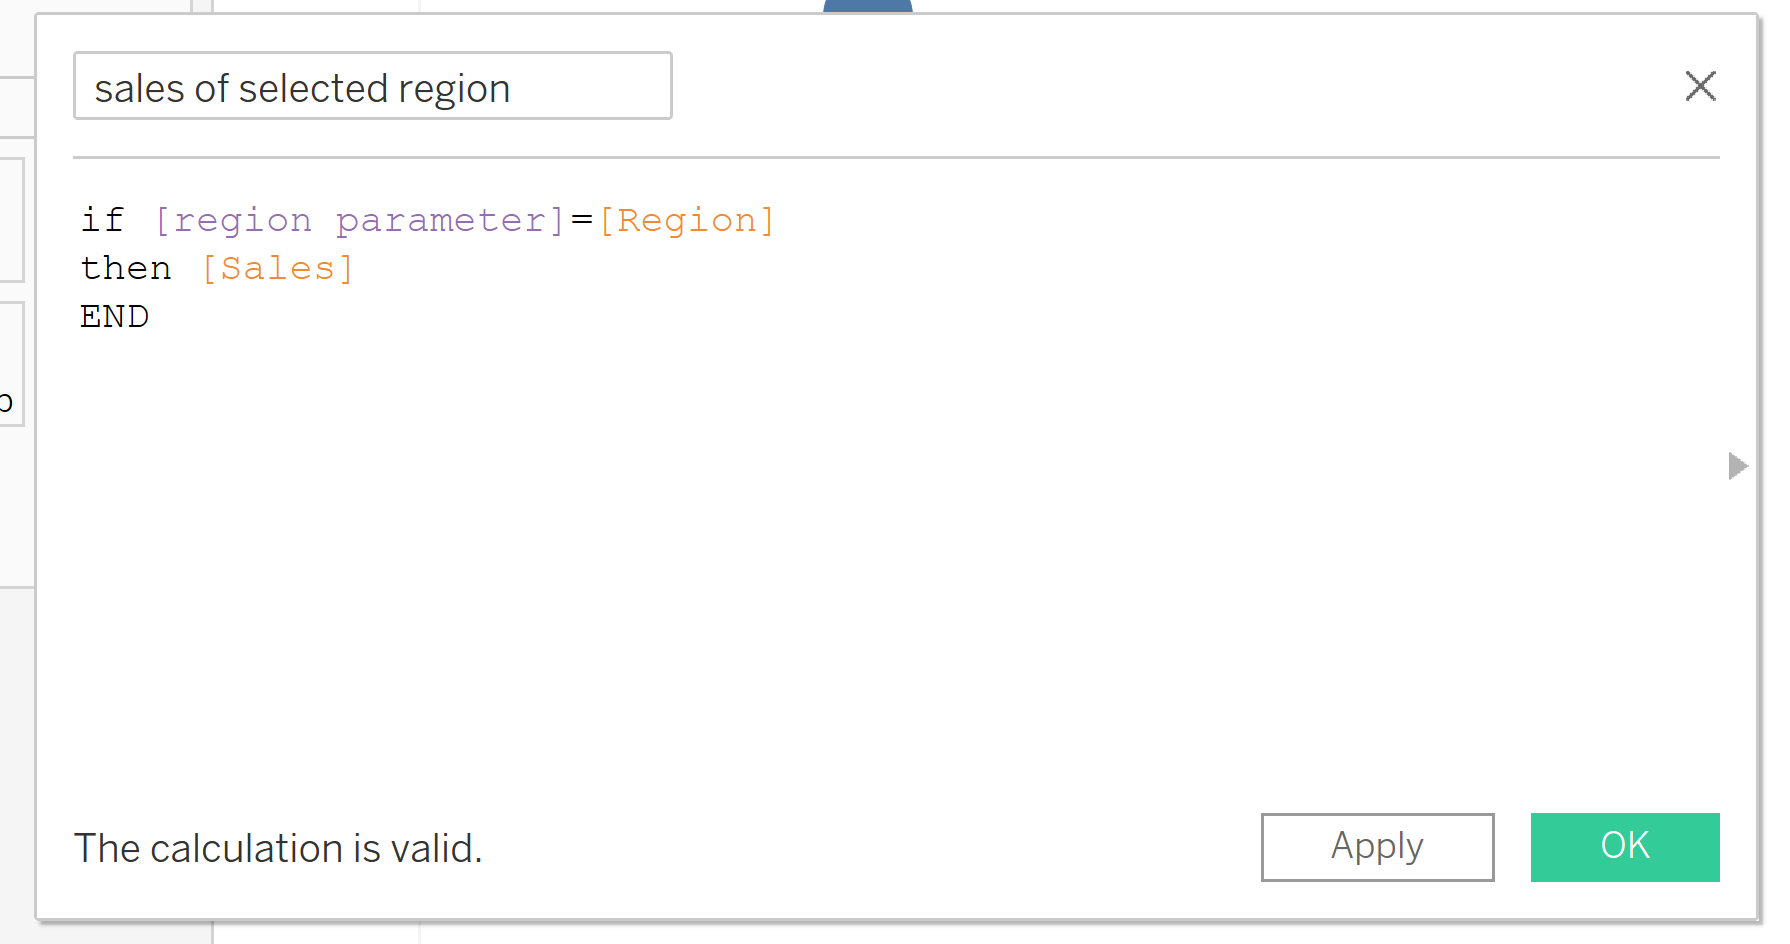
4. Create a cal. field where when the region is the one we selected then give back the sales of that region.
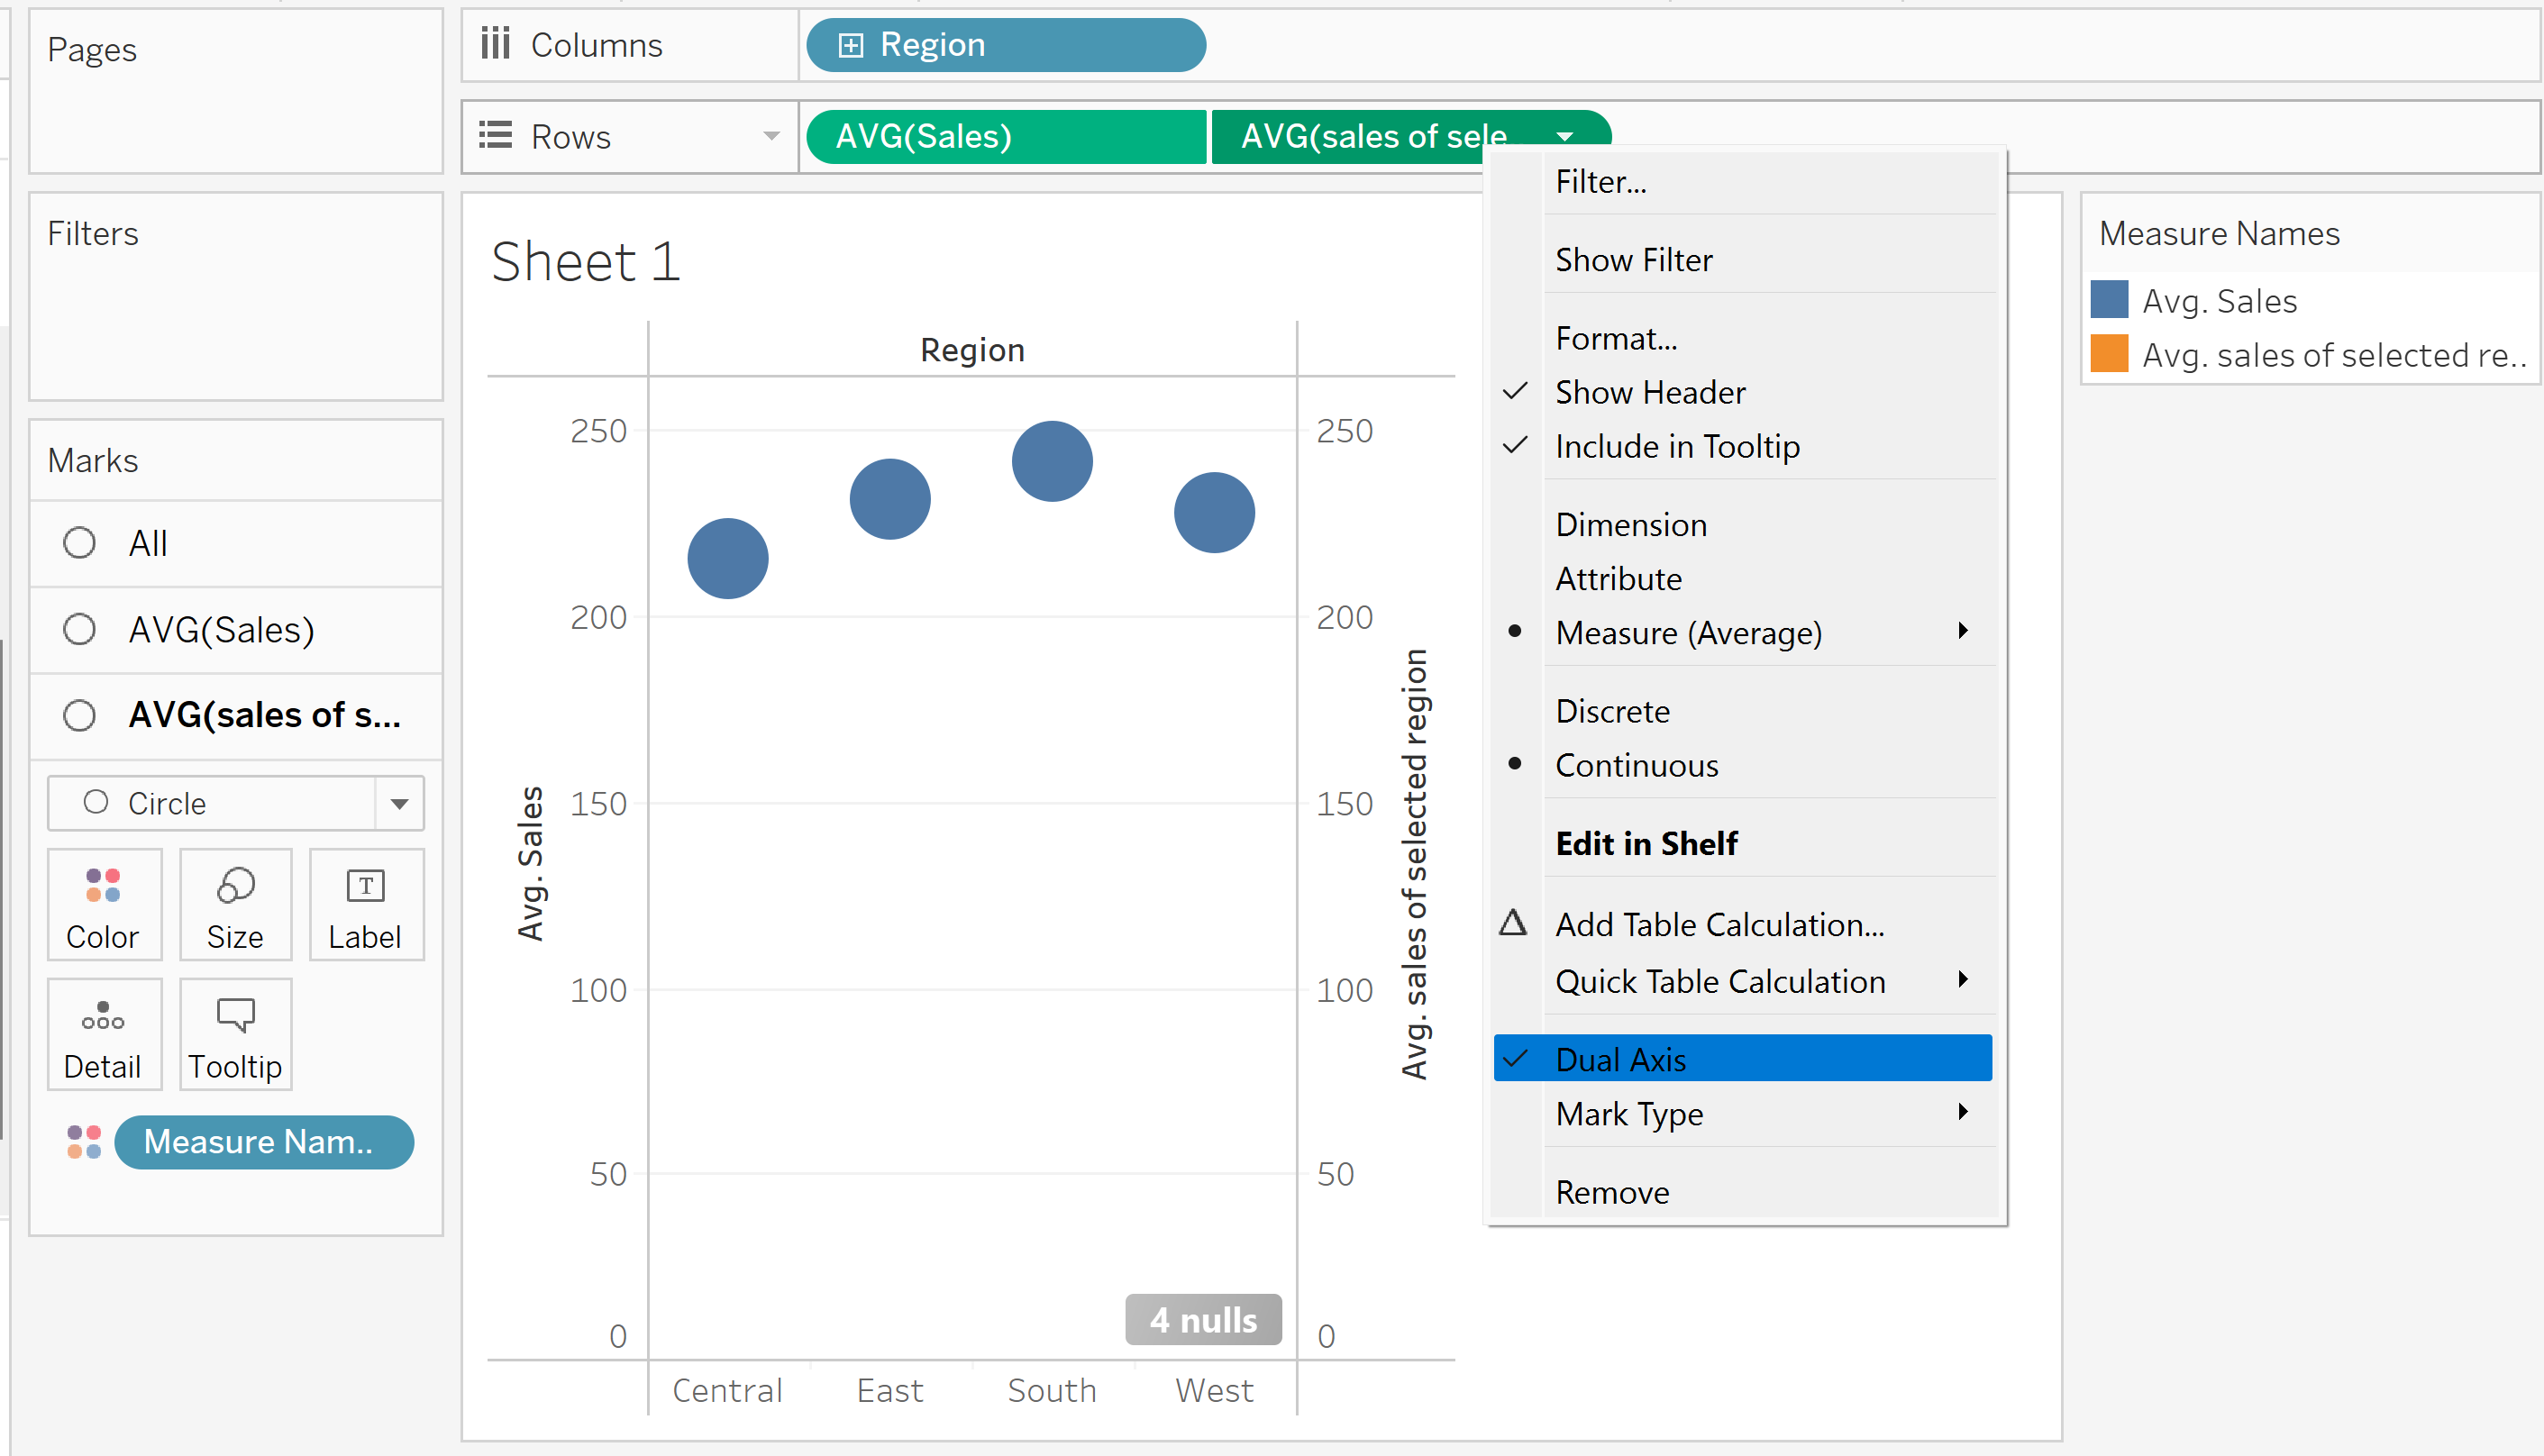
5. Put the new cal. field on rows. Right-click the pill and set it to 'Dual Axis'. Right-click the y-axis and Synchronize Axis'
6. Now what we need is do is drill down to the data points, so we need an identifier for each individual cell. Actually, in the superstore dataset, there is a hidden row identifier called 'row ID'. To call it out, we expanded the option of the data pane and select 'show hidden field'. Also, we right-click the row ID and select 'Unhide'.

7. Put the row ID on the detail mark of second pills. Hide the indicator. Resize the circle for better display.
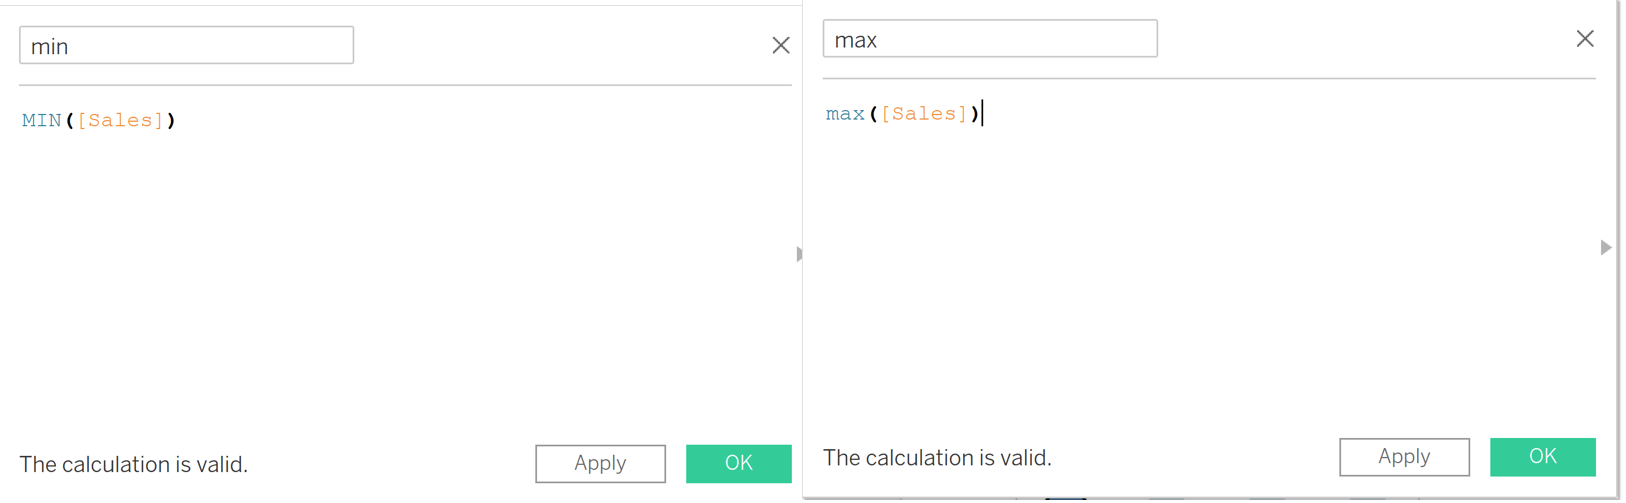
8. Now we need to make the bar-like structure behind the dot. Create two cal. fields: Min. and Max. of sales. Drag them on the detail mark of the first pills. Make a reference band run from min. to max of sales. Remove the redundant tooltips and change the colour of line.
9. Finally, if we click our region dot now, it will highlight the one we are clicking. To disable this, create a 'dummy' calculation and put it on the details mark of all pills. Click the highlight action on the top of the view and select 'dummy'. Here is our chart!
If you like it, feel free to check out my other posts and connect with me on Linkedin - learn and improve together!
https://www.thedataschool.co.uk/blog/stanley-chan