The parameter enables the user to interact with the dashboard or the graph in multiple ways. One of those is to filter the data to be displayed. It is similar to the Quick filter option, the main difference being the inability to select all the provided options. But there are workarounds available to achieve this. In this blog, I will be explaining one of those.
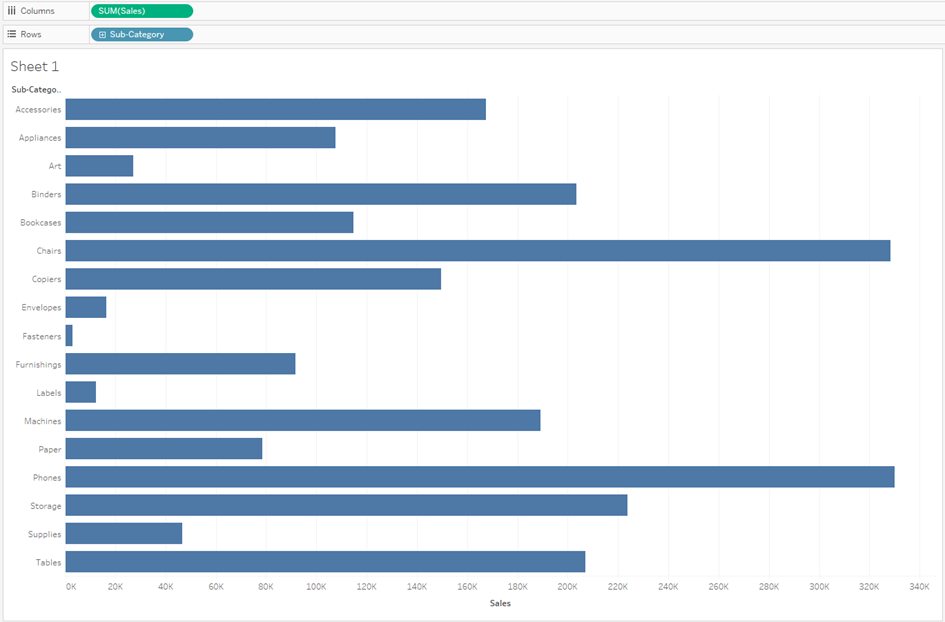
Using the Sample Superstore dataset, I created a simple bar chart as shown below.

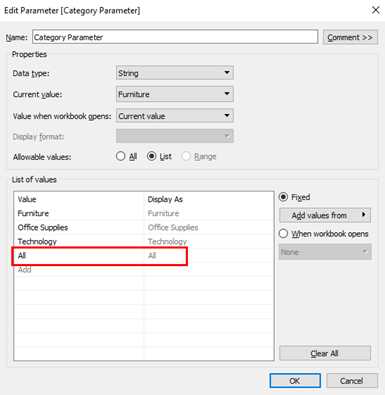
The next step is to create a parameter, that enables the user to select between different options provided. Since we want to provide the user the option to select “All”, this should be added explicitly while creating the parameter as shown below.

A calculated field is then created based on the value of the parameter. For that, the below formula is used.
CONTAINS([Category], [Category Parameter]) OR [Category Parameter] = 'All'
The first part of the formula, that is the function CONTAINS() checks whether the selected value in the parameter is present in the field “Category” and will return True or False based on the result. The second part of the formula checks whether the value selected in the parameter is equal to “All”. Since the result is True or False, the datatype of the field will be automatically saved as Boolean.

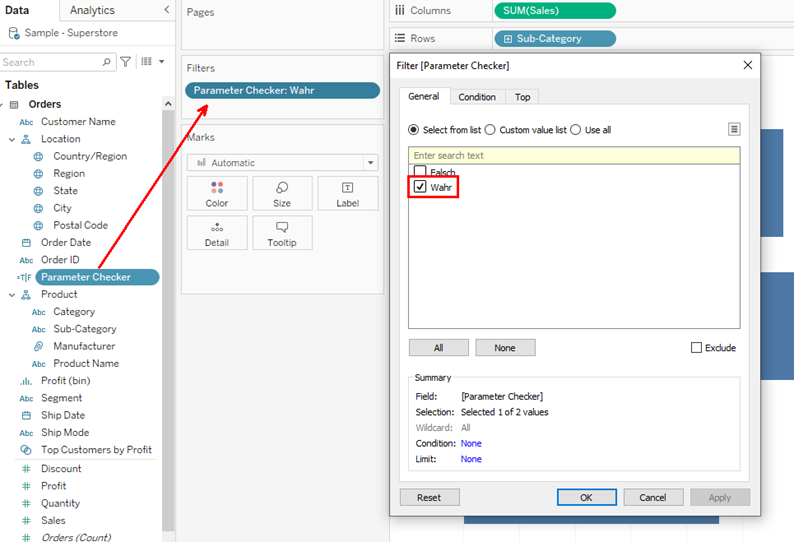
The new calculated field is then added to the area Filters and only True values are displayed as shown below.

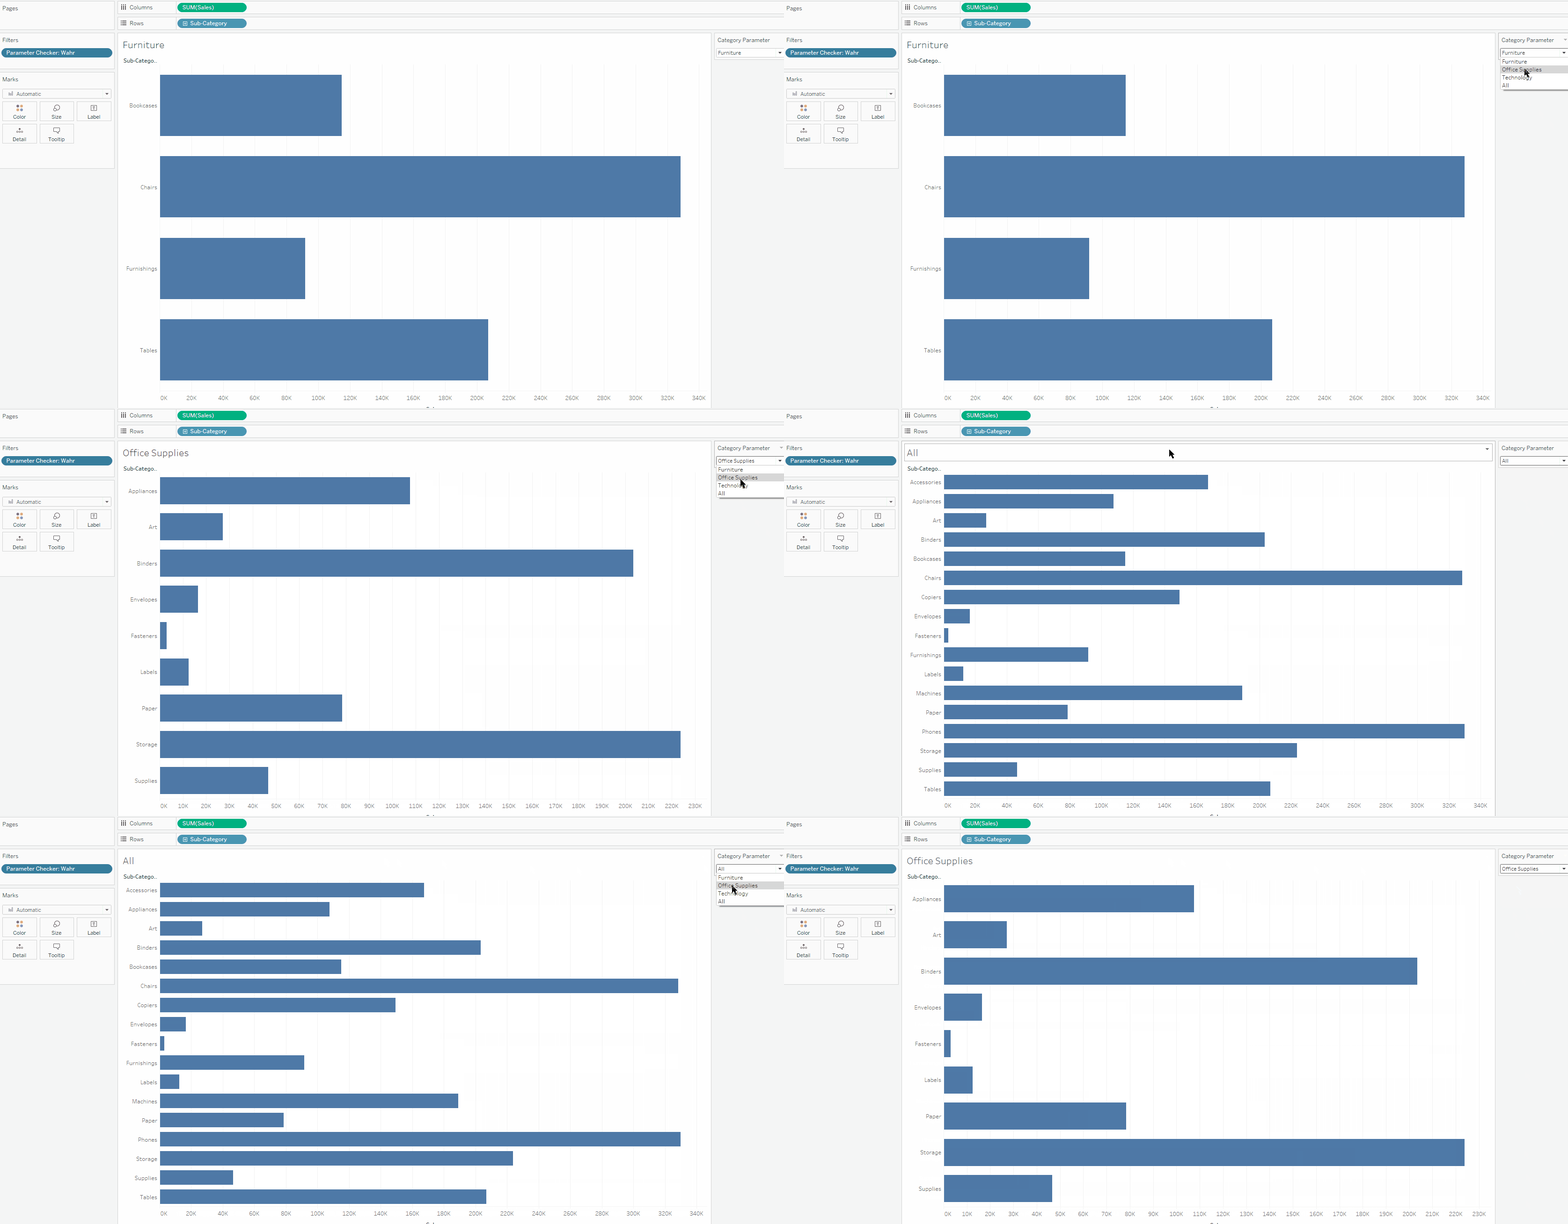
The parameter with the functionality to select “All” is now created. It can be tested by adding it to the view and selecting the option.

Slicing data using a parameter offers the advantage when compared to a Quick filter in that it is mostly performance-wise faster, especially when the dataset is quite huge or the slicing needs to be performed on multiple charts in a dashboard. One important disadvantage to be considered while using the parameter is its inability to select multiple values. One needs to analyze the situation and use the best option accordingly.
