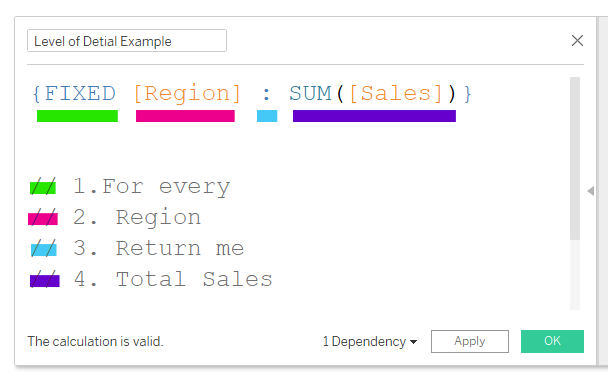
The example below shows a basic level of detail expression, using sample superstore data, and will be used to explain the logic behind level of detail calculations.
This particular calculation can be split into 4 segments which can then be read as a sentence. This sentence reads: 'For every region, return me the total sales'. FIXED means 'for every', and what follows will be the dimension you want to group by. In this case I wanted to group by Region which will then only be interested in looking at Central, East, South, and West (the headers in the field 'Region'). The colon means 'return me', and what comes after the colon will be the measure you want to be returned. The measure will always need to be aggregated.
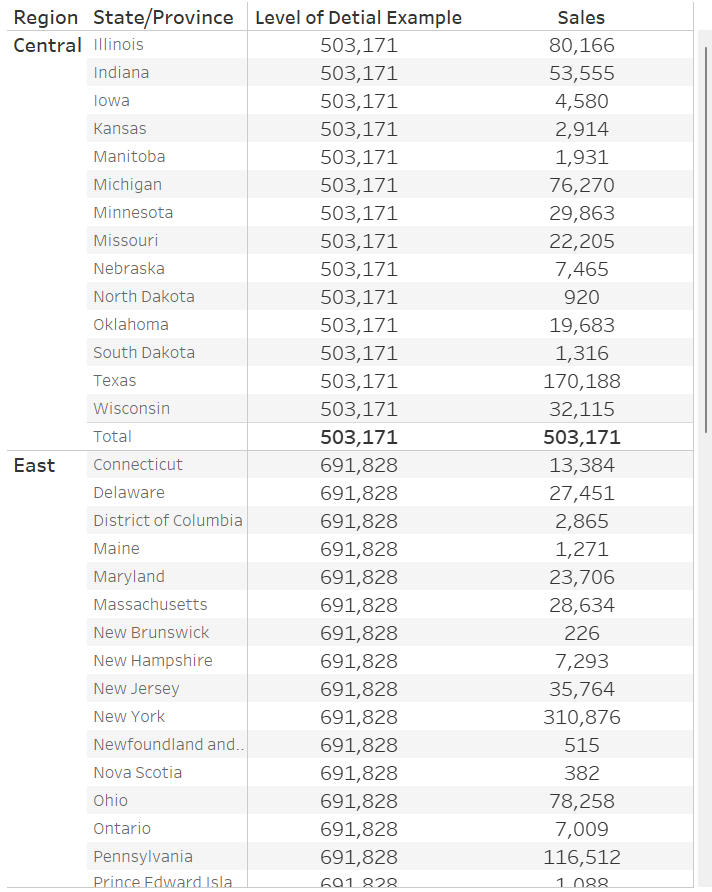
The table below shows all the states included in a region, with the example LOD and sale amounts as numbers. The sales for each state will be different, as expected. However, the example LOD returns the same number for every state within that region. This gives a clearer picture of what the LOD is doing. In other words, regardless of what is on the view, we are asking the LOD to only focus on the regions, and return those sale numbers. Therefore, it is adding up all the state sales within one region and only returning that number. This is why the total sales number is the same as the LOD.
After getting to grips with the concept of LODs, lets move onto comparing the current and previous years.
1st
Make a 'Current Year' calculation which is laid out like the calculation below.
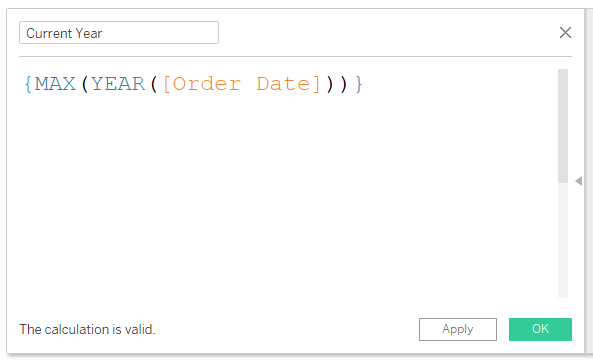
This calculation looks slightly different to the first example, and this is because the word FIXED is not in the view. This is still a fixed calculation, but unlike the first example, there is no specific dimension that we are asking the LOD to concentrate on (the first example concentrated on the 'Region' dimension). When the word FIXED is not in the view and the curly brackets { } are, Tableau's default is to make the calculation fixed, and saves time when writing it out.
The calculation is essentially saying looking at everything in the dataset, return me the highest possible year in the given date field.
2nd
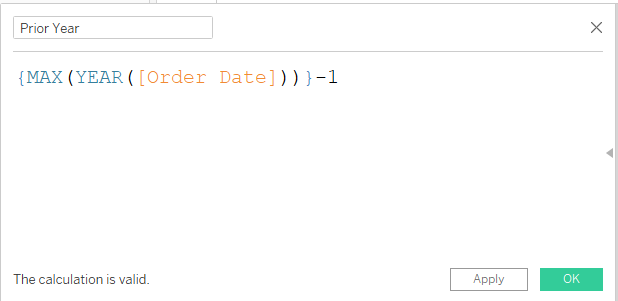
Make a 'Prior Year' calculation by duplicating your 'Current Year' calculation and putting -1 at the end of it. This is looking for the highest year and taking away 1 to get the second highest year.
Now we have both the years we want to compare, we need to return the sales for both those years.
3rd
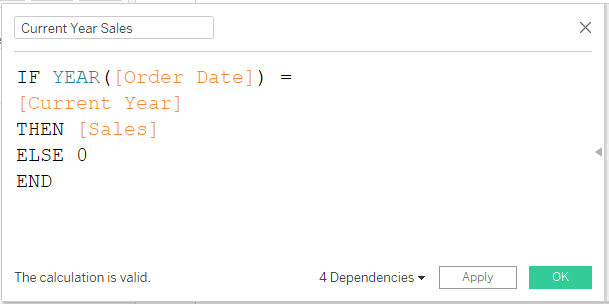
Create a calculation like the one below for the sales of your current year. This calculation is stating that if the year of your date field is the highest year available then return the total sales for that year, and return 0 for the other years.
4th
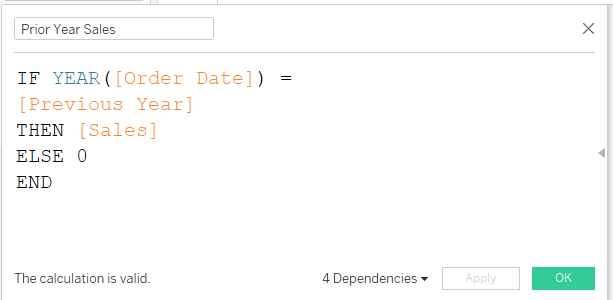
Duplicate the 'Current Year Sales' calculation and change the current year field to your previous year field. This will return you the total sales for the previous year.
5th
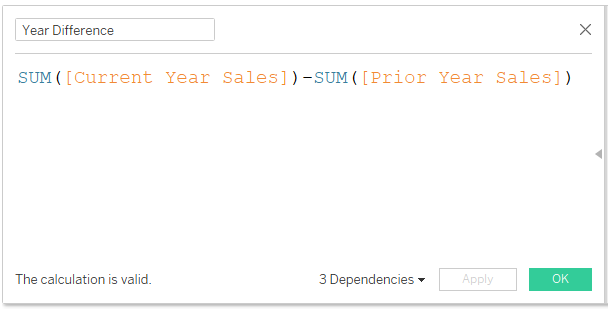
Now to find the difference between them both to see if there were more sales this year compared to last year.
6th
Now to use your calculations on your sheet. In my example I was splitting the view up by Segment and Category. I then dragged the current year sales onto the rows and prior year sales onto the axis (until there are two green rulers), to create the side by side bar chart. After, I placed the difference calculation onto the Measure Values Card and copied the Measure Names onto colour.