Scope: MUST use the API. Build an Alteryx App that allows the user to pick a date range, category, and postcode. The app must then render a Tableau KPI dashboard automatically.
The API website in question: https://data.police.uk/docs/method/crime-street/
Firstly
I copied the example API URL : https://data.police.uk/api/crimes-street/all-crime?lat=52.629729&lng=-1.131592&date=2017-01
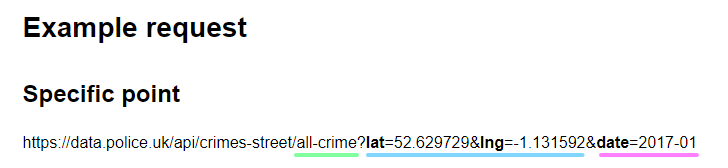
In this URL, there were three sections that were dynamic and could be changed: type of crime (green), the location (blue), the date (pink). These sections of the URL is what will change when the app is created.
Postcode
As the API only includes longitude and latitude coordinates, and the requirements needed a post code, I needed to render coordinates from a given post code. To do this I needed a Mapbox API.
The Mapbox API URL I used in the text tool: https://api.mapbox.com/geocoding/v5/mapbox.places/ec4m9br.json?access_token=pk.eyJ1Ijoiam9lbC1ha2FqZS1tYWNhdWxleSIsImEiOiJjbDUwcnpxbDAwOGc4M2ptdHRyNzFzeW5lIn0.jK5VSpIGDtF1oQkfVHRv5w
The bold and italic section of this URL is the postcode that is input and the data that the API gives back is the longitude and latitude of this area.
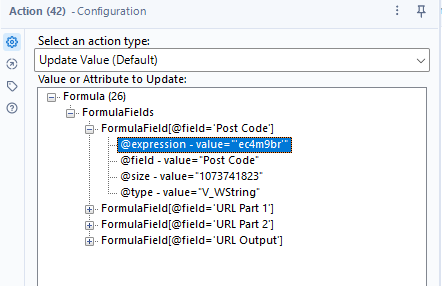
As the post code needs to be dynamic and update when a new post code is given, I had to use a formula tool to split the URL into 4 sections.
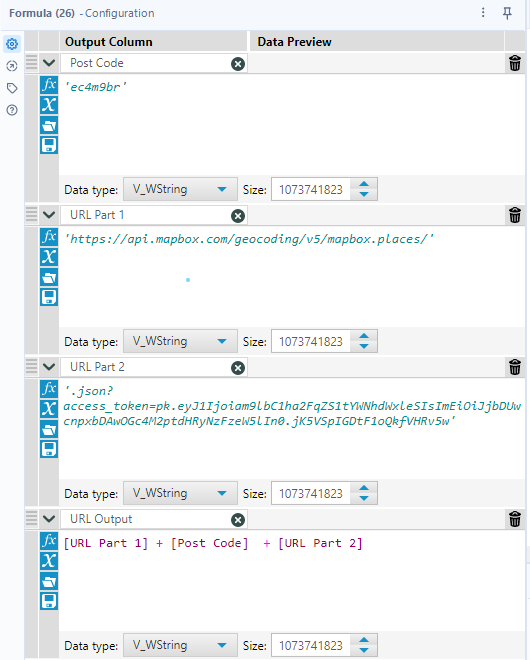
The 'Post Code' is the section that is changing so these letters/numbers are singled out and put into quotations ( ' ' ). The 'URL Part 1' column is the first half of the URL that comes before post code, and the 'URL Part 2' is the second half of the URL that comes after the post code. Everything needs to be in quotations as it is a string. The 'URL Output' is the final output of the URL which will be used to download the data, creating a 'DownloadData' column. Next, a JSON Parse tool is needed to split all of the data into separate rows, and uses the 'DownloadData' field to do so. The data is then cleaned using Select tools and a Cross Tab.
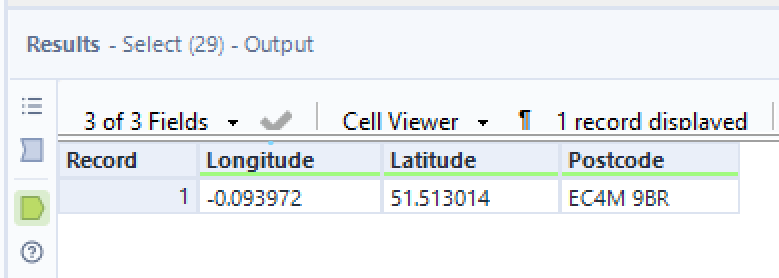
The final clean output just returns the Longitude, Latitude, and Postcode of the area you have input.
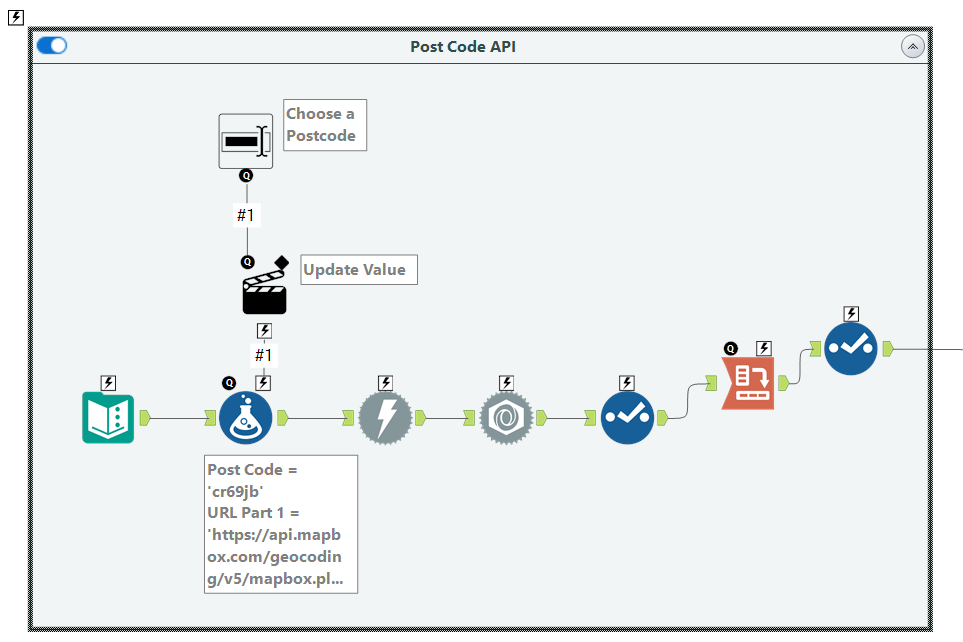
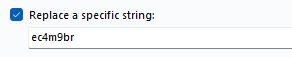
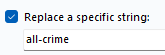
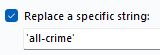
To create the App that changes the postcode, I needed a text box tool, as this is where the user will type the new post code. The Text Box is connected to an Action tool, which is connected to the Formula tool. The text box tool is configured as below, which shows that the only value that is changing in the Formula tool is the Post Code section. You need to select 'replace a specific string' and enter the current post code that needs to change, otherwise the the quotations will disappear when replacing the string.
Date and Crime Category
The final output for the postcode workflow is then linked to the Crime API workflow. This second workflow focuses on changing the year, month, and crime category of the police API data.
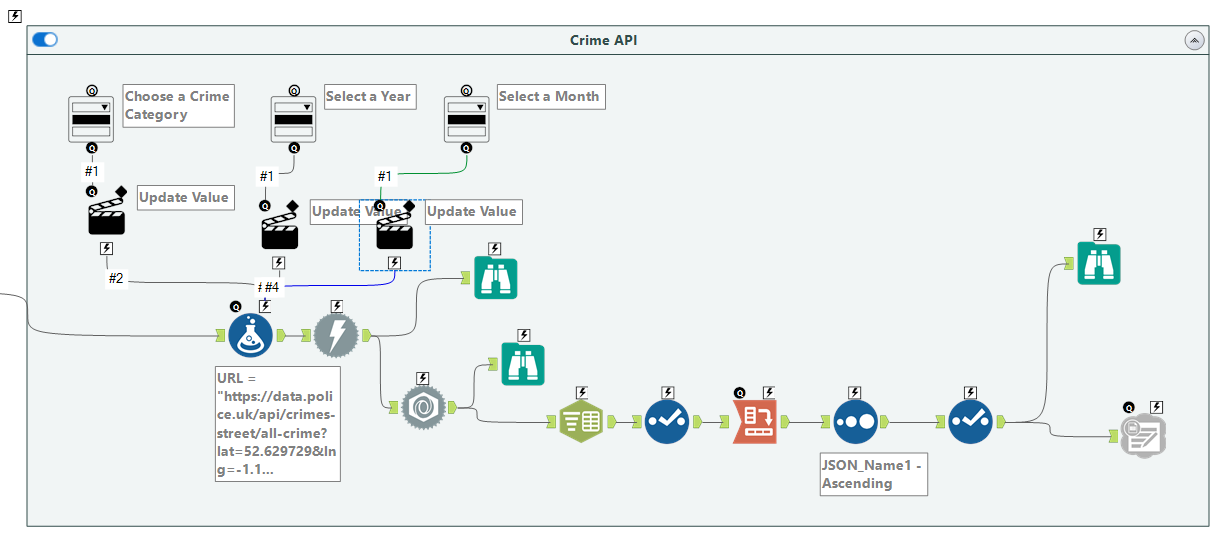
The last Select tool in the Mapbox workflow is connected to the first formula tool in this workflow. The formula tool is configured as follows:
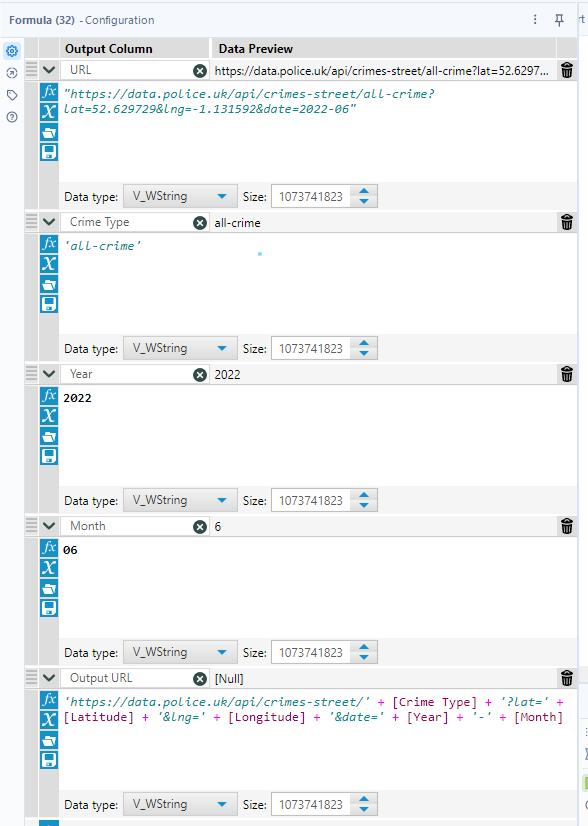
This formula tool is essentially doing exactly what the other formula tool is doing in the Mapbox API workflow, which is splitting the API URL into sections that need to be dynamic. It does this by creating new columns specifying the crime type, year, and month. The Output URL is used to download the data and parse it using a JSON Parse. The rest of the workflow cleans the data so it is in a digestible format.
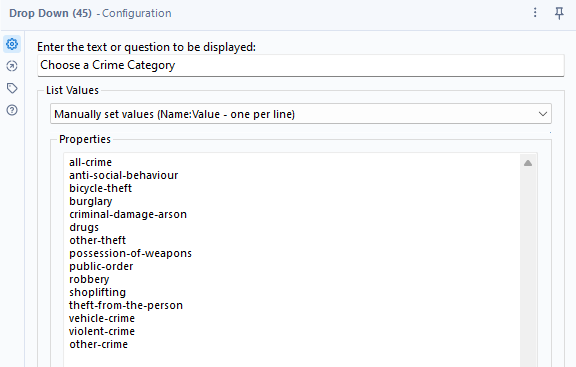
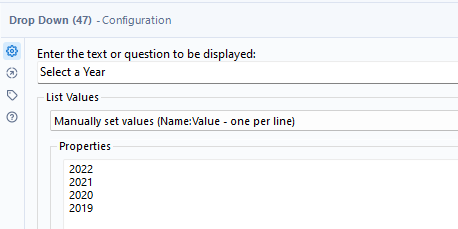
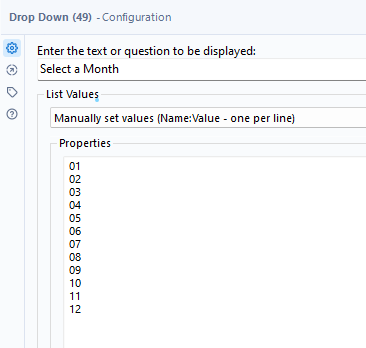
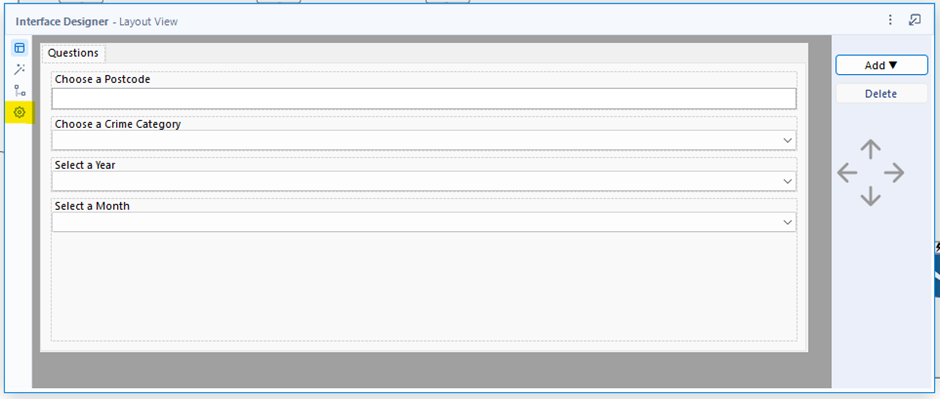
I used drop down boxes to create the Apps which allow the user to specify the crime type, year and month of their choosing. I manually set the values in the drop down tool for all.
The each actions are set so that the correct values are being changed.
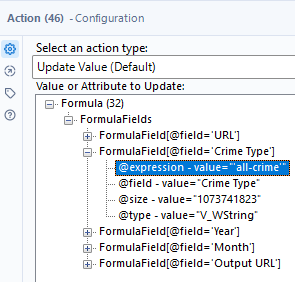
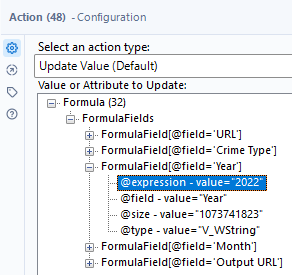
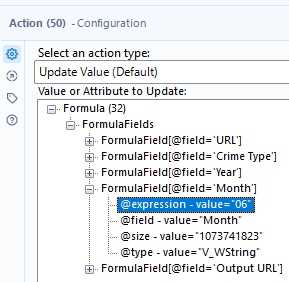
Remember: if the value that you are changing is in 'quotations' in the formula tool, then you need to select replace a specific string in the action tool, type the value that is changing, and remove any quotations. If this is not done then the quotations will also be replaced in the string to nothing.
The workflow is complete with a Google Sheet Output tool, which can be downloaded from this page as Alteryx: https://community.alteryx.com/t5/Public-Community-Gallery/Google-Sheets-Tools/ta-p/877888
I needed to use a google sheet because it can be updated in Tableau Public where I saved my dashboard to.
Configuring the App
Remember: an app needs an output or a browse tool otherwise it will not work as it has nothing to present to you.
Select 'View' and then 'Interface Designer. The Interface Designer will show all of the interface tools you have created.
You then need to select the properties (highlighted in yellow). This will take you to another page that allows you to choose an output or browse tool that you want to be updated and presented.
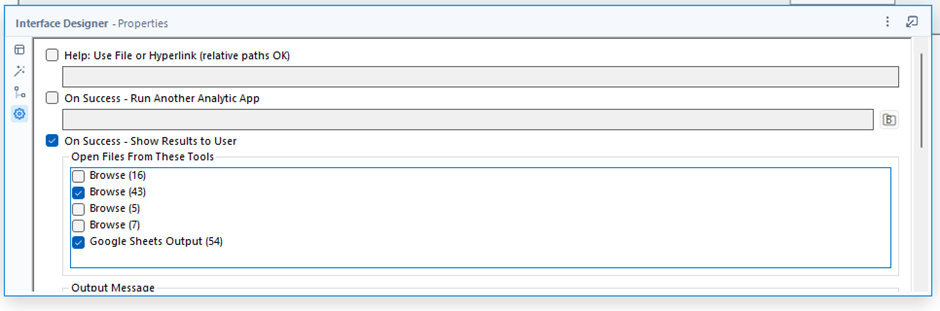
In my example I chose the last browse tool in my workflow as well as the google sheet output. After selecting your chosen tools, you can close the interface designer.
After, select the icon that looks like a wand which 'Runs as Analytical App'.
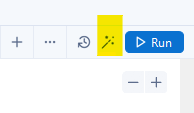
The wand will open a window which shows the App options that can now be configured to the users desire.
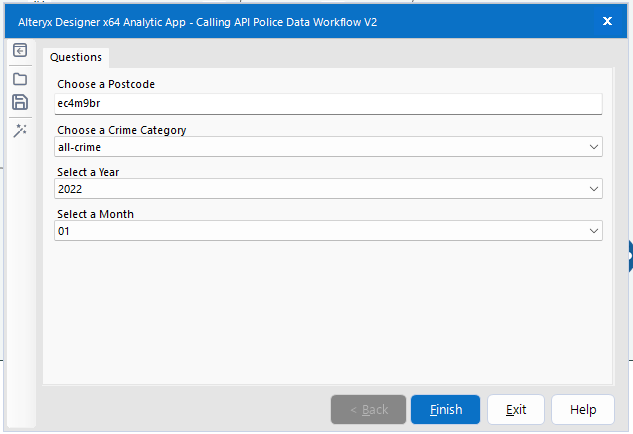
By selecting 'finish' it will update the data on the google sheet that is connected to Tableau.
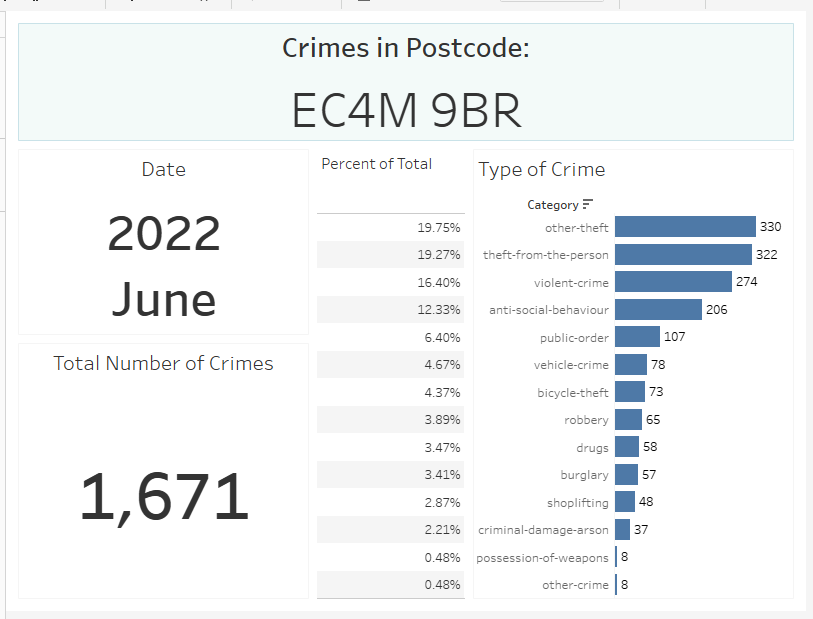
My final dashboard contained the postcode, date, total crimes, crime type as a number and a percentage.