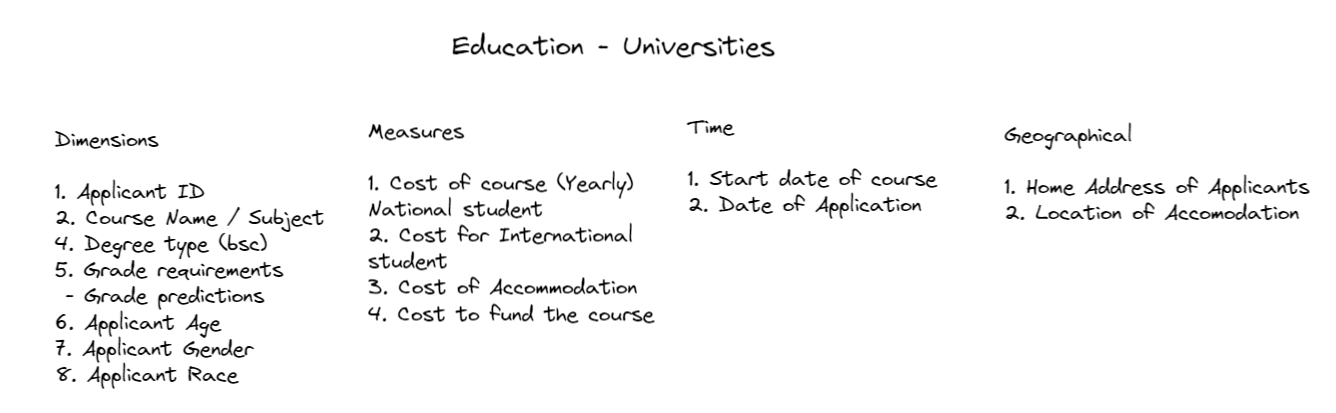
Scope: MUST include
Time series
At least 3 dimensions; e.g., products, suppliers, etc.
Geographical data
At least 4 measures; e.g., sales, profit, targets, etc.
Demographic data about customers (so there must be customers in the data set)
Anything else they wish to include in their dataset.
Plan my Dataset
Dataset showing applications to the university of Portsmouth (where I went to University).
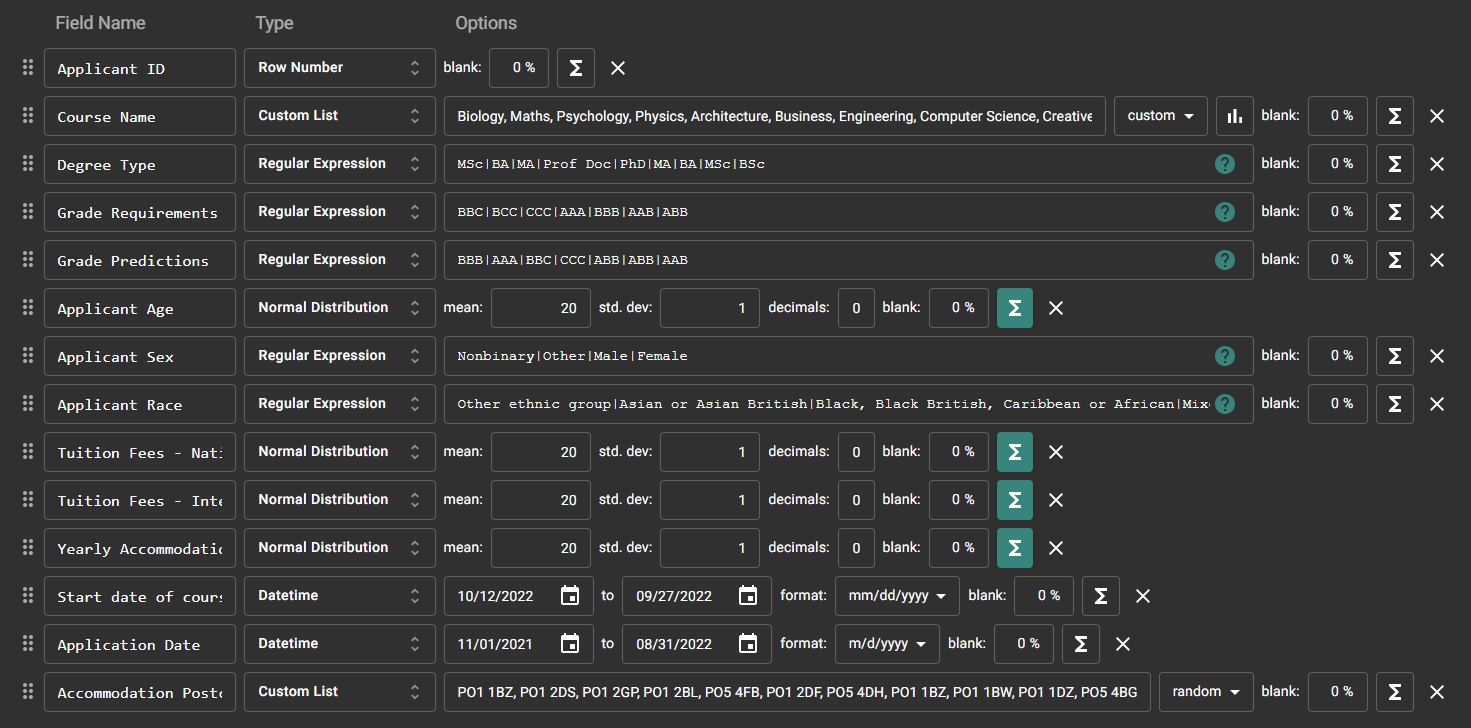
Build in Mockaroo
Each dimension, measure, time, and geographical field was created in Mockaroo. Some fields had random distributions and others were skewed with a custom distribution. All fields were created either using a regular expression, custom list, normal distribution, datetime, or row number. The second date filed needed to come after the first date field for this dataset to make sense.
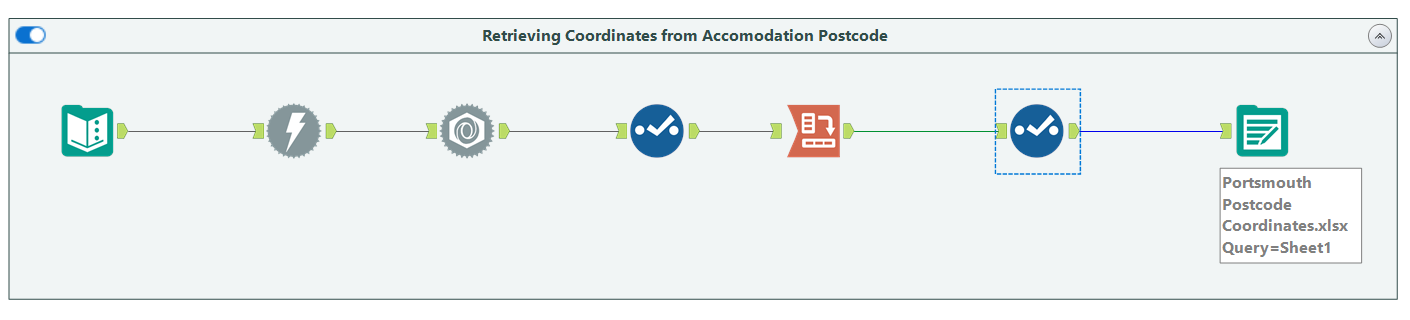
I also wanted to create spatial points for the postcodes of student accommodation buildings. To do this I used an alteryx workflow using a Mapbox API. The first workflow used the API to retrieve the longitude and latitude of the post codes of student accommodations.
The second workflow connected the coordinate data to the Mockaroo data. It did this using two find and replace tools, where the post code in the Mockaroo data was replaced with both the longitude and latitude for that given post code.
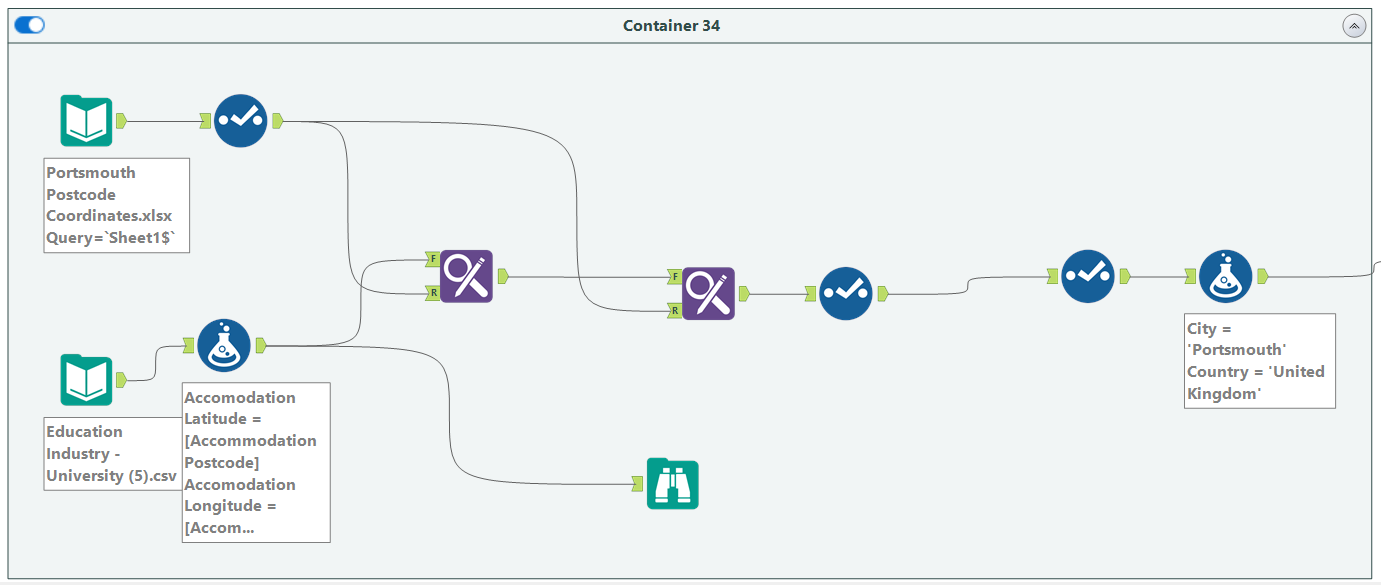
The output of this workflow was the completed dataset that I used to create my Power BI dashboard.
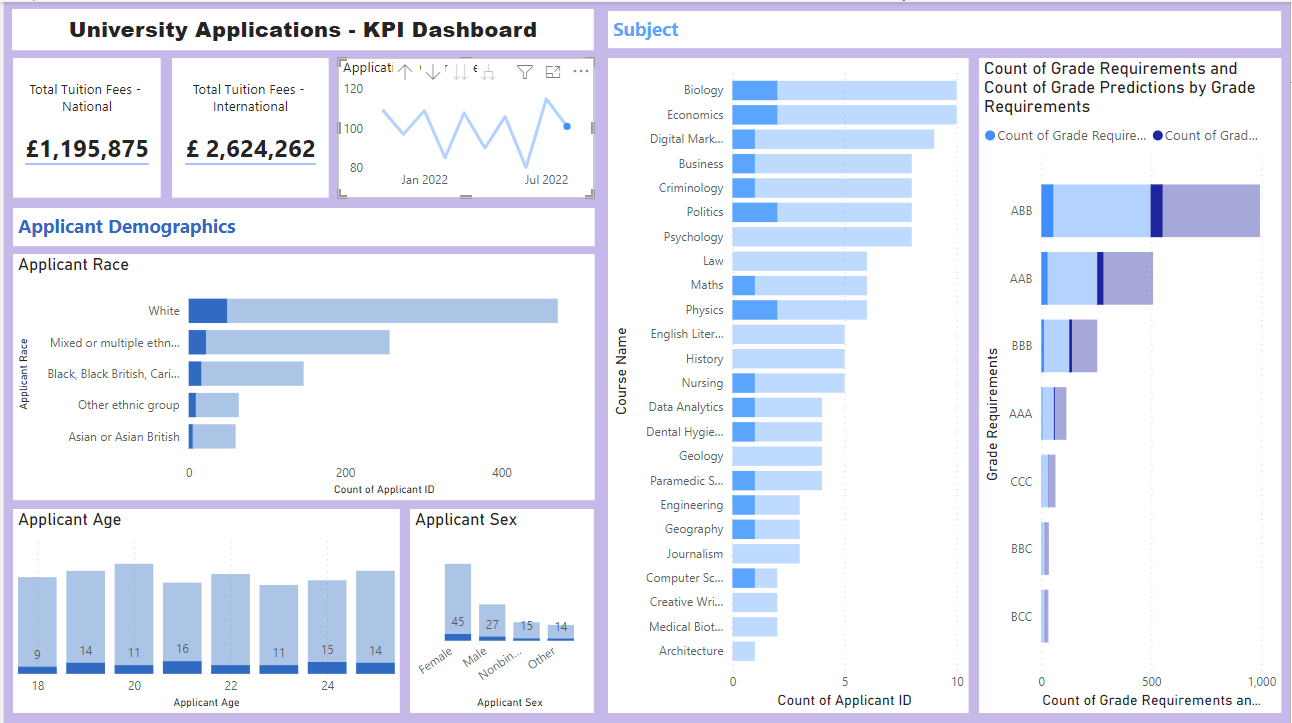
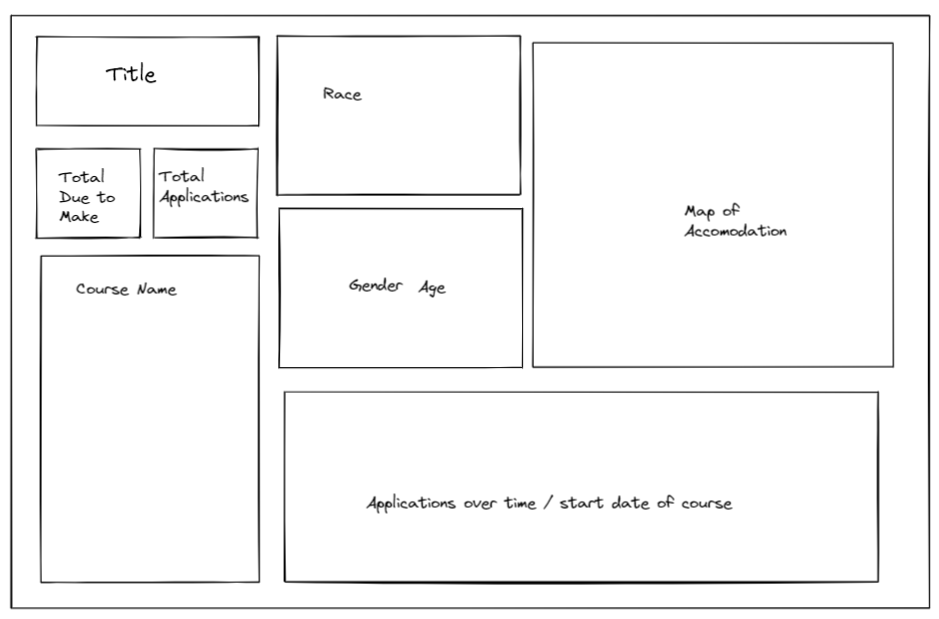
Building the Dashboard
I unfortunately gave myself less time than I wanted to build the dashboard as creating the data took longer than expected. I chose a simple design with bar charts to show the data.
Unfortunately the both the longitude, latitude and the post code data was not recognized in PowerBI and therefore I could not use to show this information in a map.
Final Dashboard