


Tableau Prep is an application used to clean and prepare data for analysis. This blog will explain the interface, allowing for an understanding of what you can do in Prep. Specifically, we'll go over the flow pane, best practices for the flow pane, and the input pane.
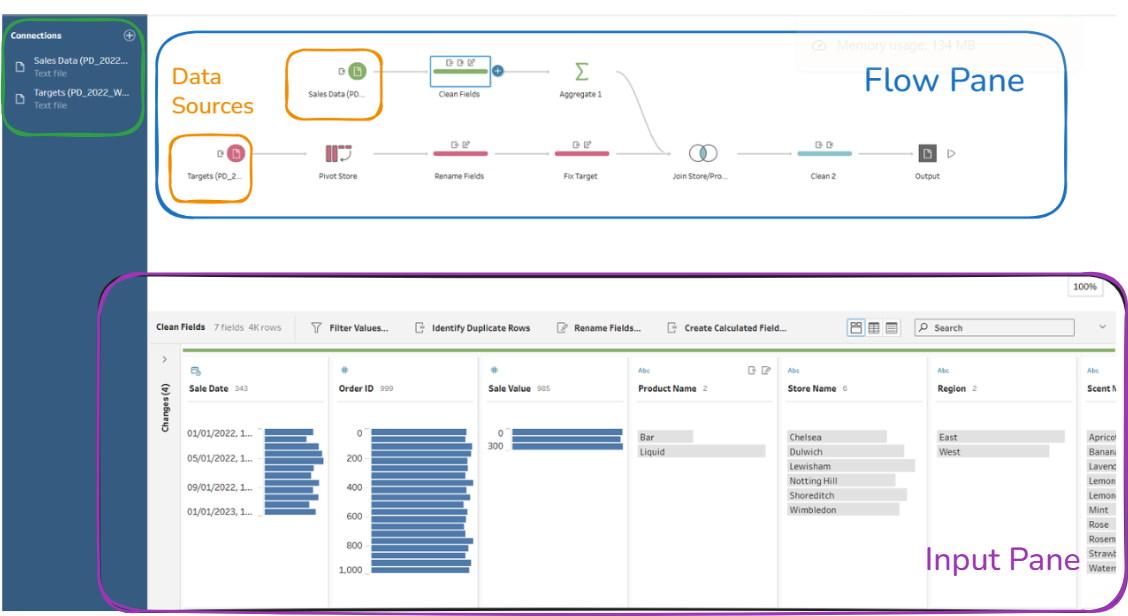
The main components of the homepage are the connection tab, flow pane, and input pane. The connection pane, as the name implies, is where you can connect to your data. Here is what a basic interface looks like:
The Flow Pane
Understand the flow pane is essential to understanding the steps taken to manipulate the data within Tableau Prep. Here is a zoomed in view of the flow:
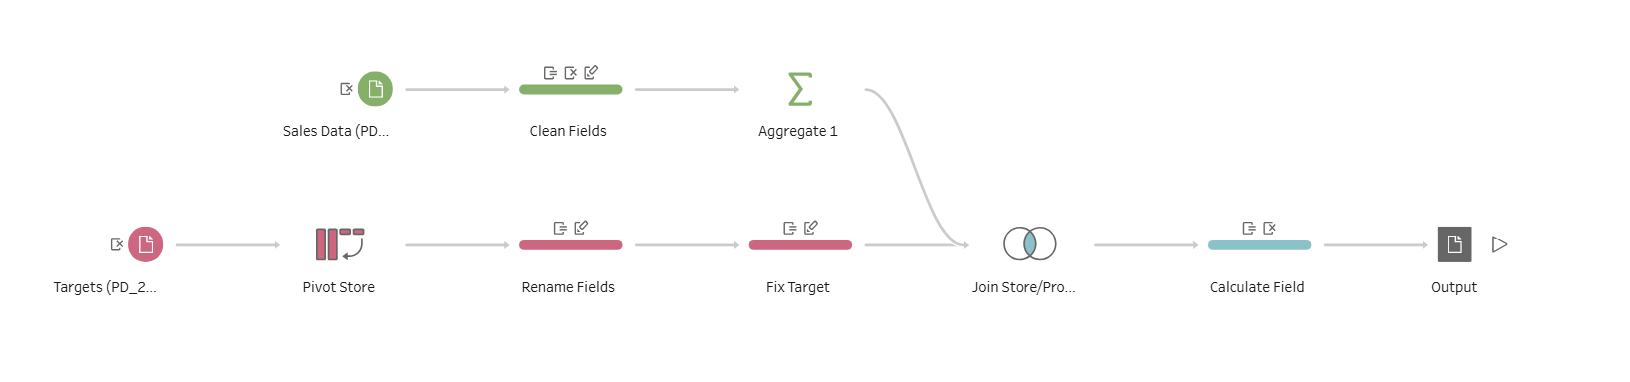
A flow begins with a data source (of which you can add multiple and labeled in orange in image 1). The different colors denote different data sources.
After adding a data source, you'll see the following options by however over the + sign near the data source:
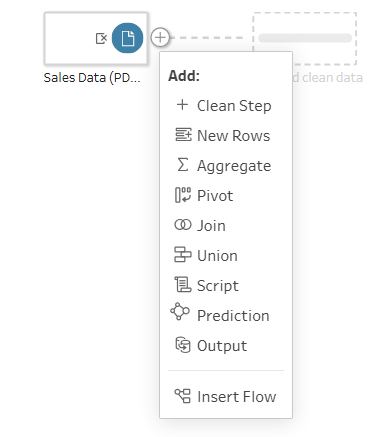
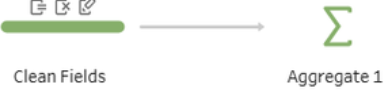
This list of items are the actions you can take with the data. For example, if you choose to aggregate, the flow will then look like this (basically, it'll add the relevant symbol):
Flow Housekeeping
It's best to label the steps you take in your flow plane (i.e., Clean1 -> Clean Fields). The Aggregate function in the above example is unlabeled, but by clicking on the name twice we can change it to a useful descriptor (i.e., Sales/Stores). By labeling others will understand what steps you took, allowing for replication. This documentation process works best when you limit the changes in each step to 5-6, which can be seen in the input pane.
Input Pane
Here are some key aspects of the input pane:
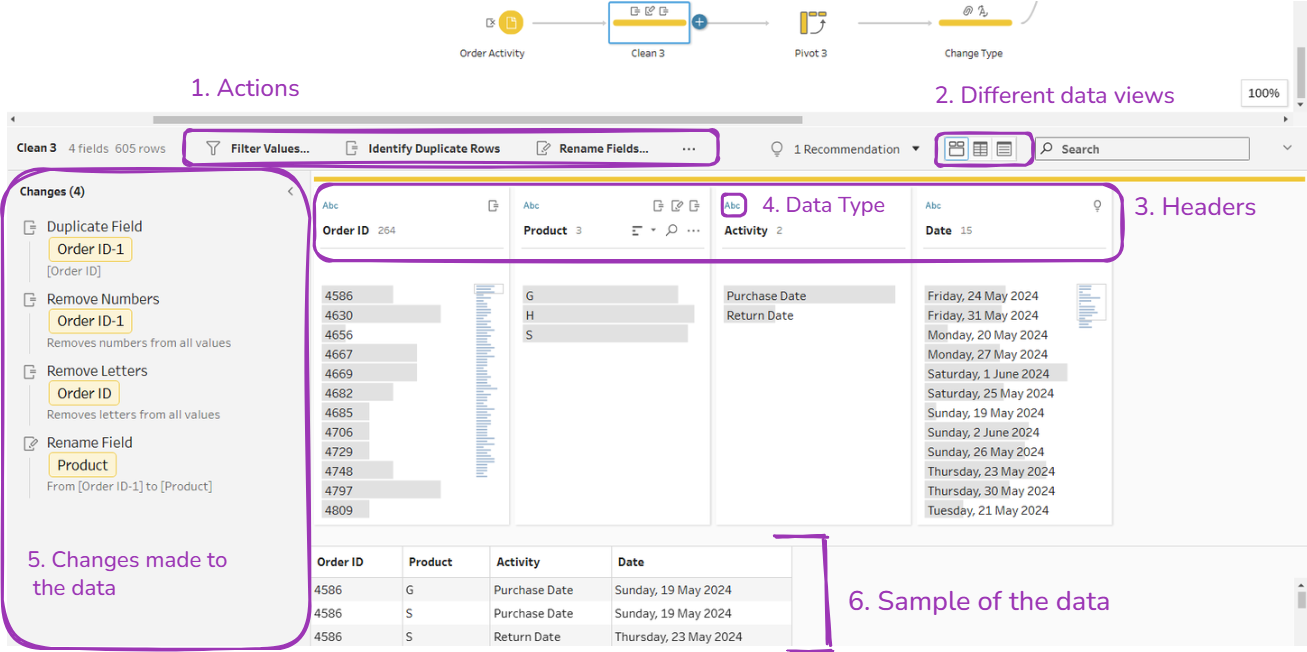
- You can take action in the pane in this area. Hitting the ellipsis will present more options.
- In this area you can see different views of your data, including looking at the table that you can see a bit of in 6., and a table with field names and changes.
- Here are the headers, which you can click on directly to change the name of. The ellipsis in this area can also be used to take action, and the bar symbol near "Product" in this example means you can sort by that item.
- Here you can change the data type by clicking on the symbol. Once clicked on, you'll see a drop down menu explaining each data type
- Here are the changes made in this step of the data, the area I referenced in the flow pane when I mentioned the importance of keeping the changes per step under 5-6 changes. The arrow to the top right of this area will allow you to open and close this view.
- Here lies a sample of the data.
Now that you know the main elements of the interface, good luck on your Tableau Prep journey!