


LAST() is a helpful function for understanding the position of data, and only seeing certain data in the view. This blog will go over how to use LAST() in Tableau by providing a definition, general walkthrough, and detailed example of LAST() being used for a YoY KPI.
What does LAST() do?
LAST() shows how far something is from the last position. It can be imputed as is (see calculated field below).
Calculated field:

LAST() in the text box:
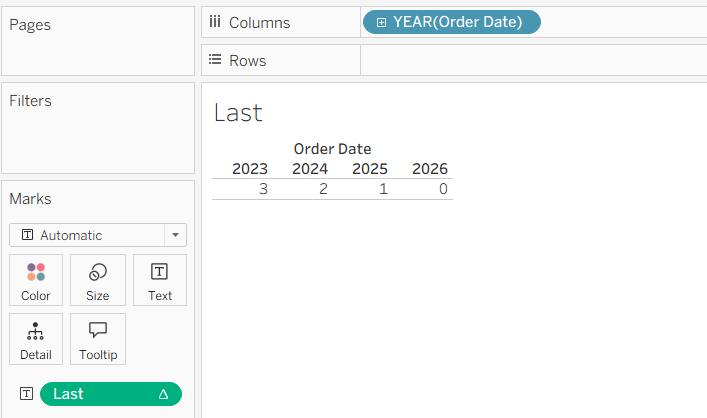
Here, each year is assigned a value based on LAST(). For example, the 3 underneath 2023 means that 2023 is 3 positions away from the last position, which is 2026 at 0.
LAST() Example: General walkthrough
LAST() can be used to filter values by position. So, for example, if I was analyzing sales by year but only wanted to see sales for 2026, I could do the following steps:
- Use LAST() to check the position
- Create a calculation that only gives me that position
- Put that calculation into the filter
Here is the use of LAST() to check positions:
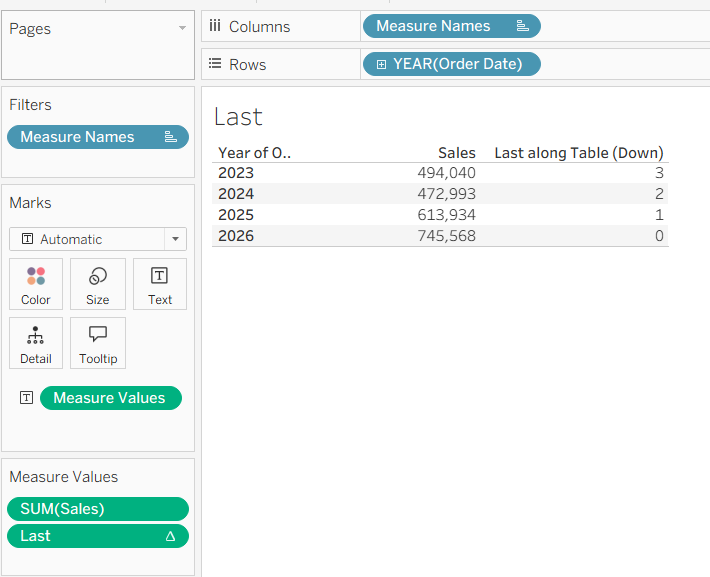
The calculation is as follows:

And now that it's in the filter, you'll see that only the sales for 2026 are in the table:
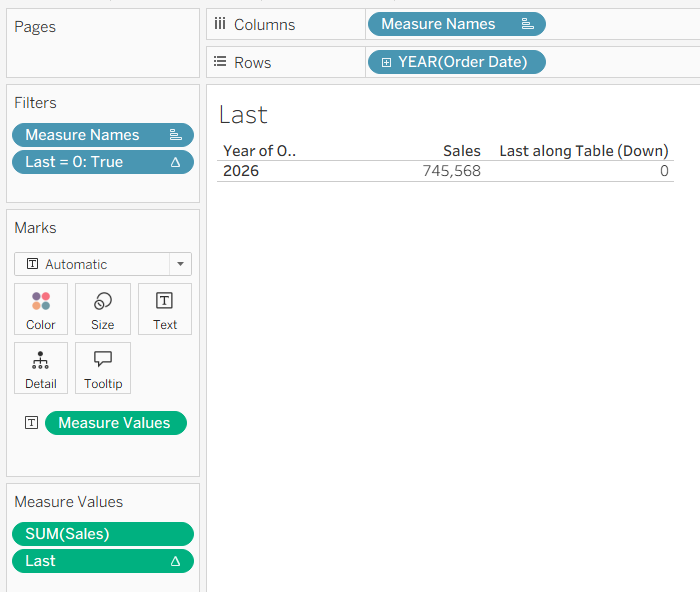
If I didn't want the position '0' in the table, all I need to do is remove the initial LAST() from measure values.
This can be used for Year-Over-Year KPIs, making it useful for retaining a previous year calculation without the previous year being in the view. In the next section I'll walk through an example.
LAST() Example: YoY KPI
In this example, I'm going to walk through making a KPI for yearly region sales, including information about previous year sales, using the Sample Superstore. The end goal is to only see the latest year, 2026.
First I'm set up a chart for year, region, and sales.
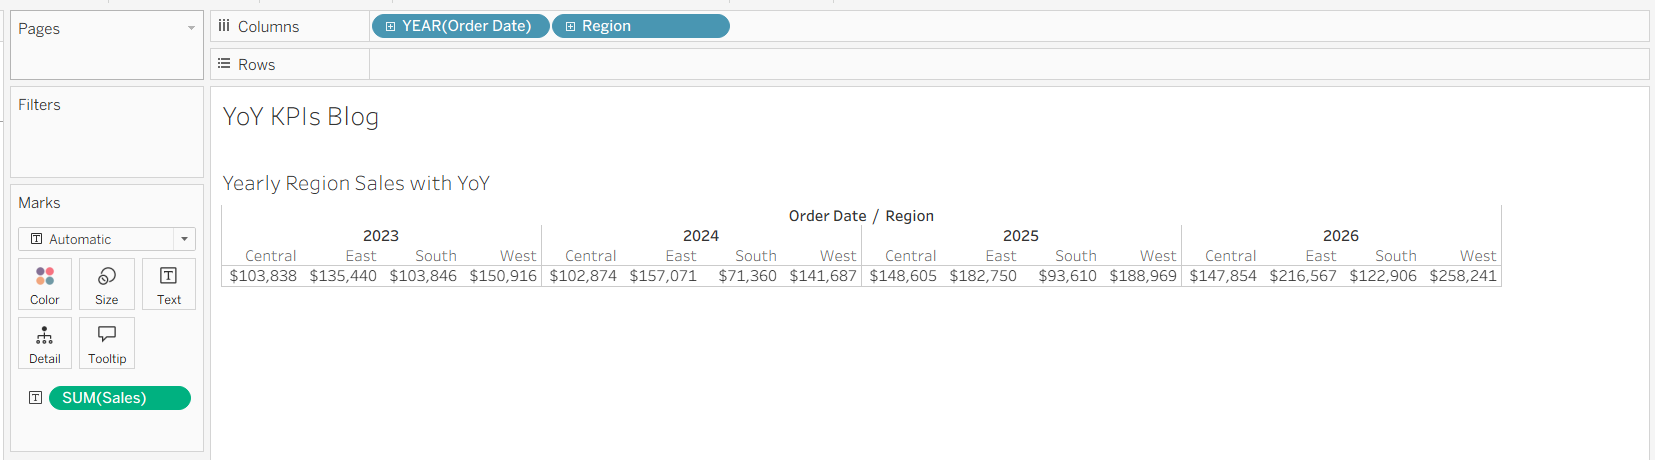
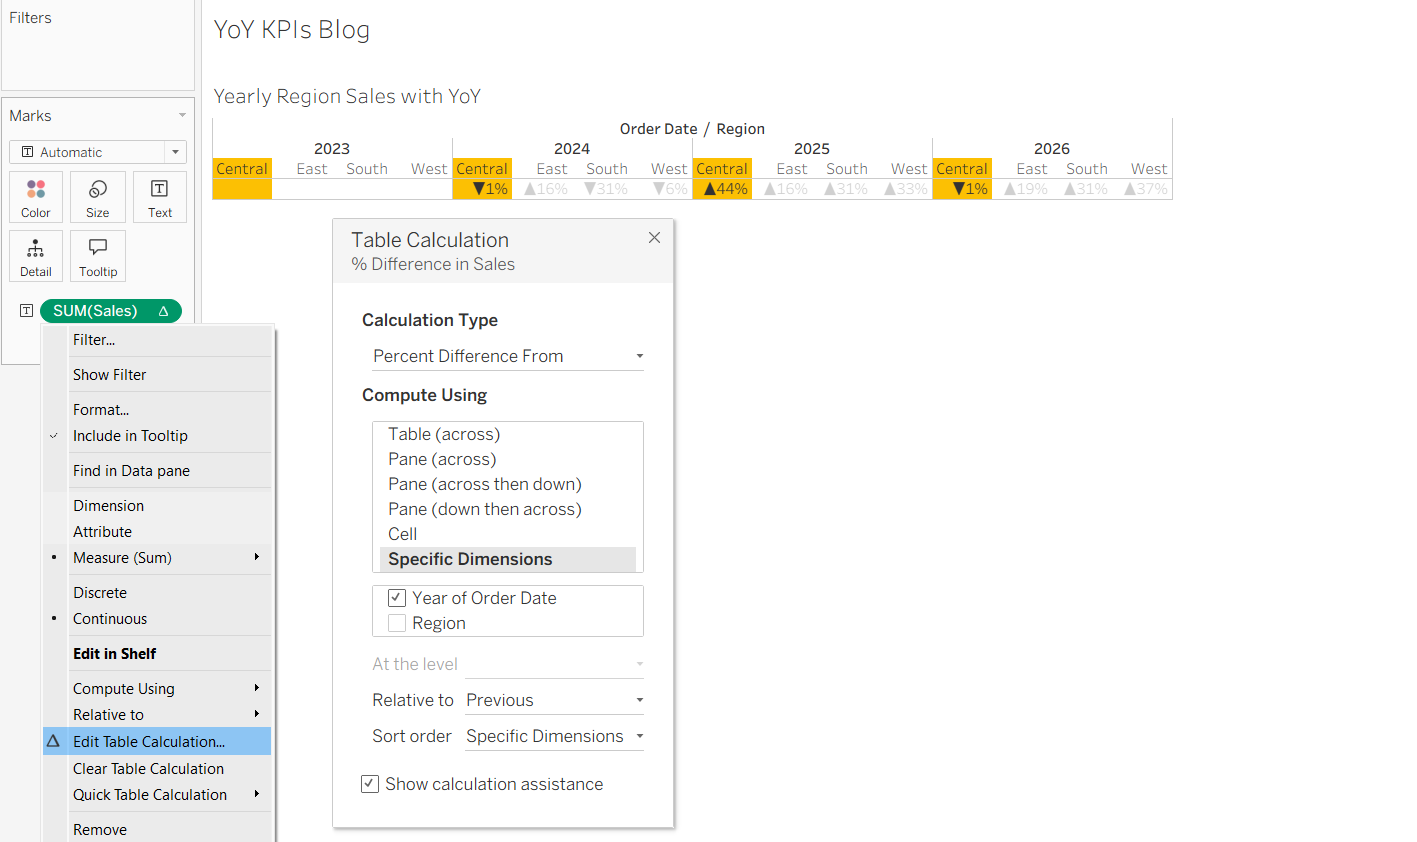
Next, I right-clicked on sales, clicked on add table calculation, and added the following in order to get a percentage from the previous year:
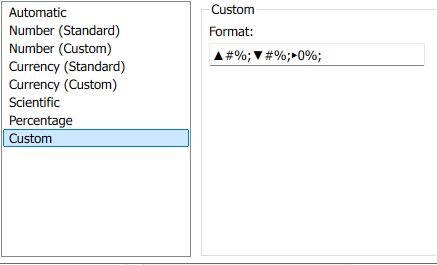
I also formatted this as a percentage:
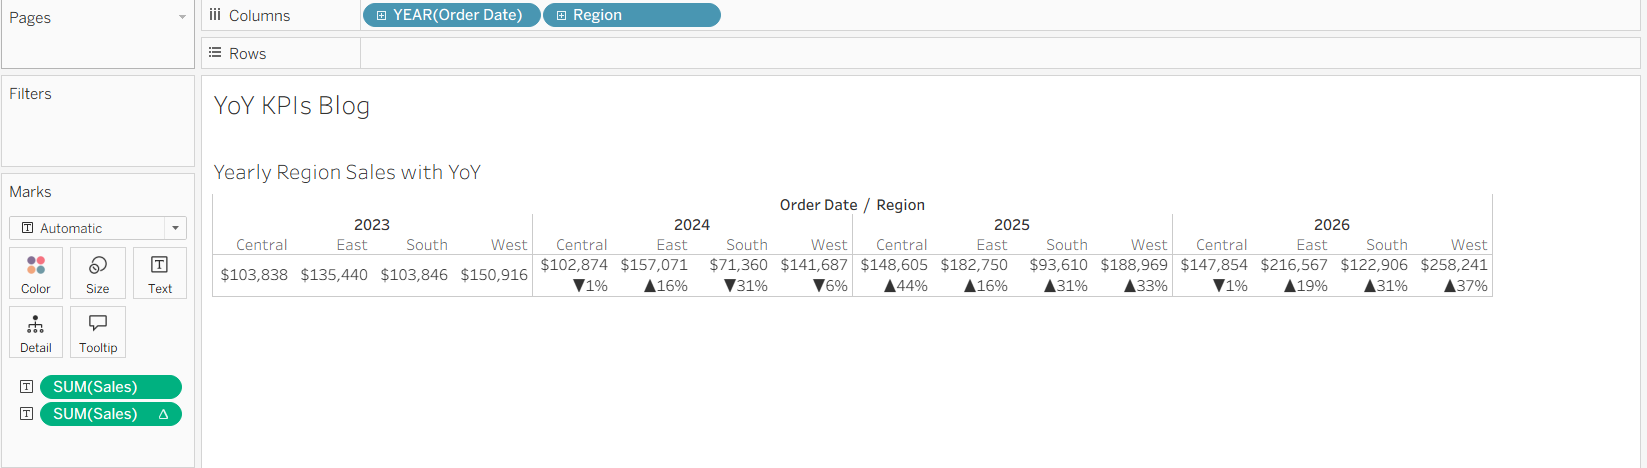
Now, after adding in sales onto text again and formatting that as currency, I have the following:
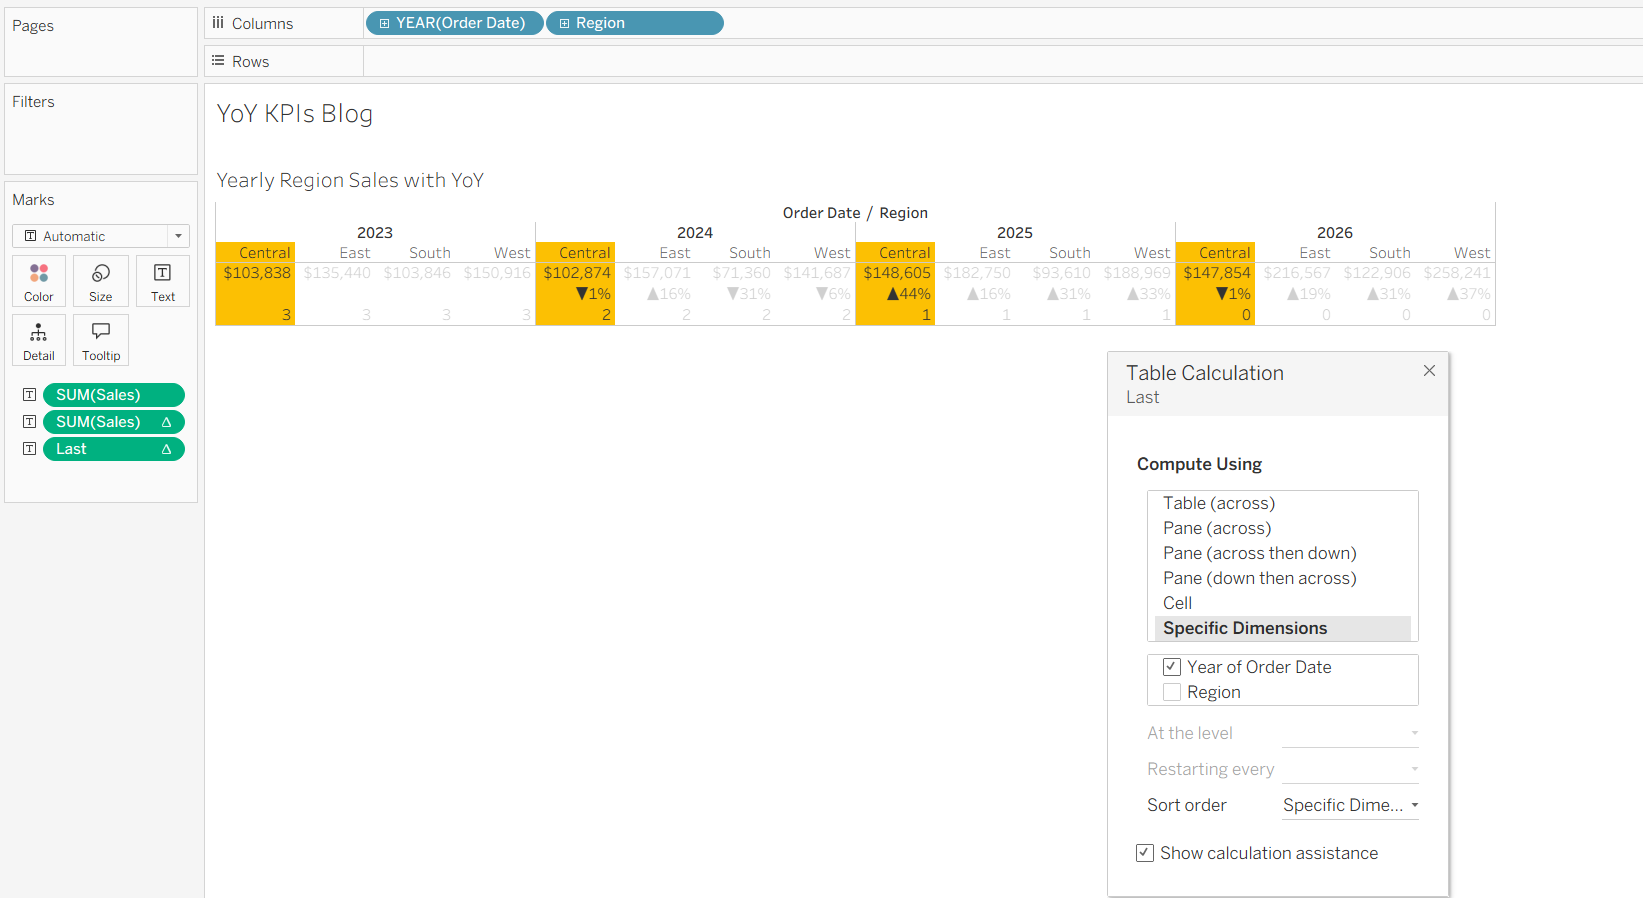
The new goal is to change the view to only show 2026. By using LAST() and computing by year, I can see that 2026 is at 0. Computing by year is very important, as computing by region instead will limit us to only the first region.
Here is what the LAST() looks like:
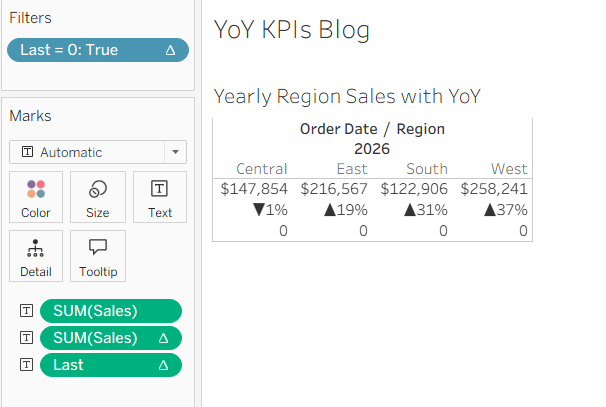
Now, by putting LAST() = 0 into the filter, making sure it's still computing by year, and clicking "True", I get the following:
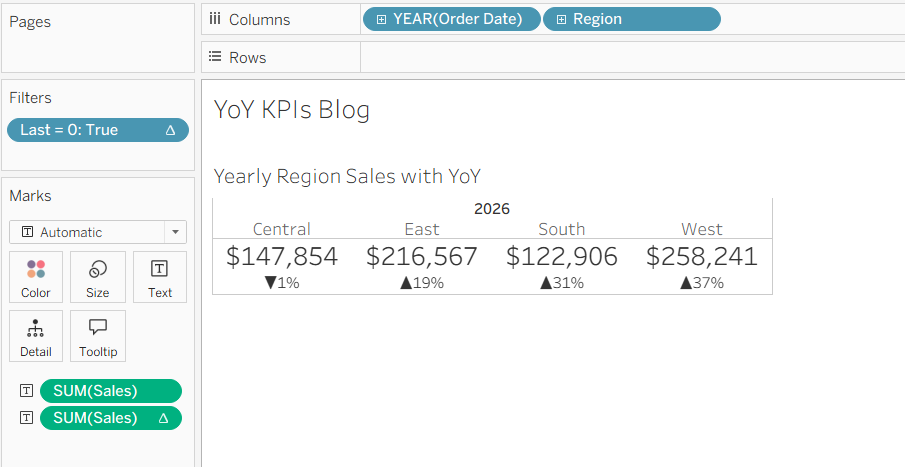
After formatting (removing LAST() from text, increasing font sizes, centering, etc.), I now have this lovely KPI:
I hope this blog helps you understand and utilize LAST() effectively!