In this blog post I'll be discussing the intentions behind my FDA Drugs dashboard.
Executive View
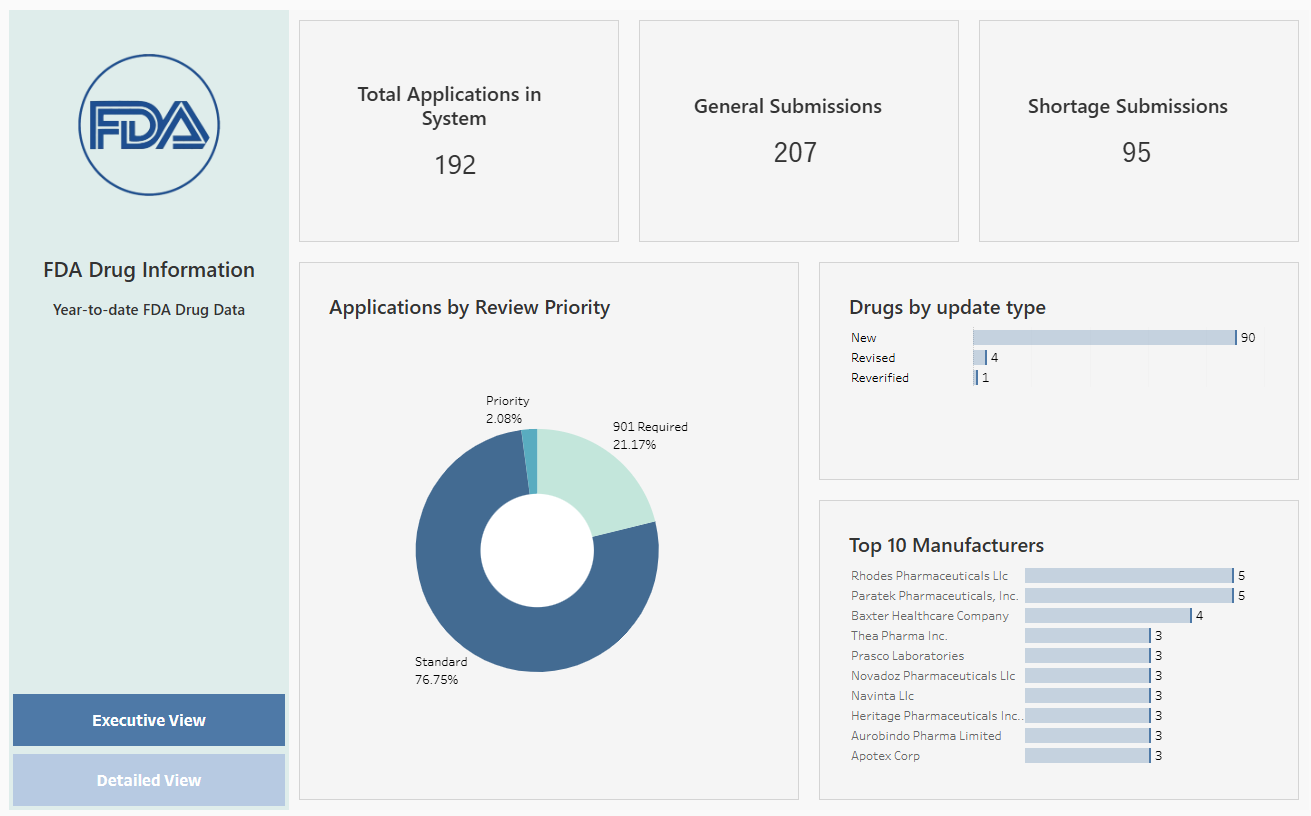
The goal of the executive view is to allow executives to quickly understand the FDA Drug Application landscape. To do this, there'3 3 key KPIs: Total Applications, General Submissions, and Shortage Submissions. This allows the executive to understand what makes up the applications, the insight here is that there are more shortage submissions than general ones, a possible area for concern.
Then, there's a donut chart showing priority levels, allowing executives to be relieve that most applications are standard. Then, there's a dynamic bar chart showing the top manufacturers.
Detailed View:
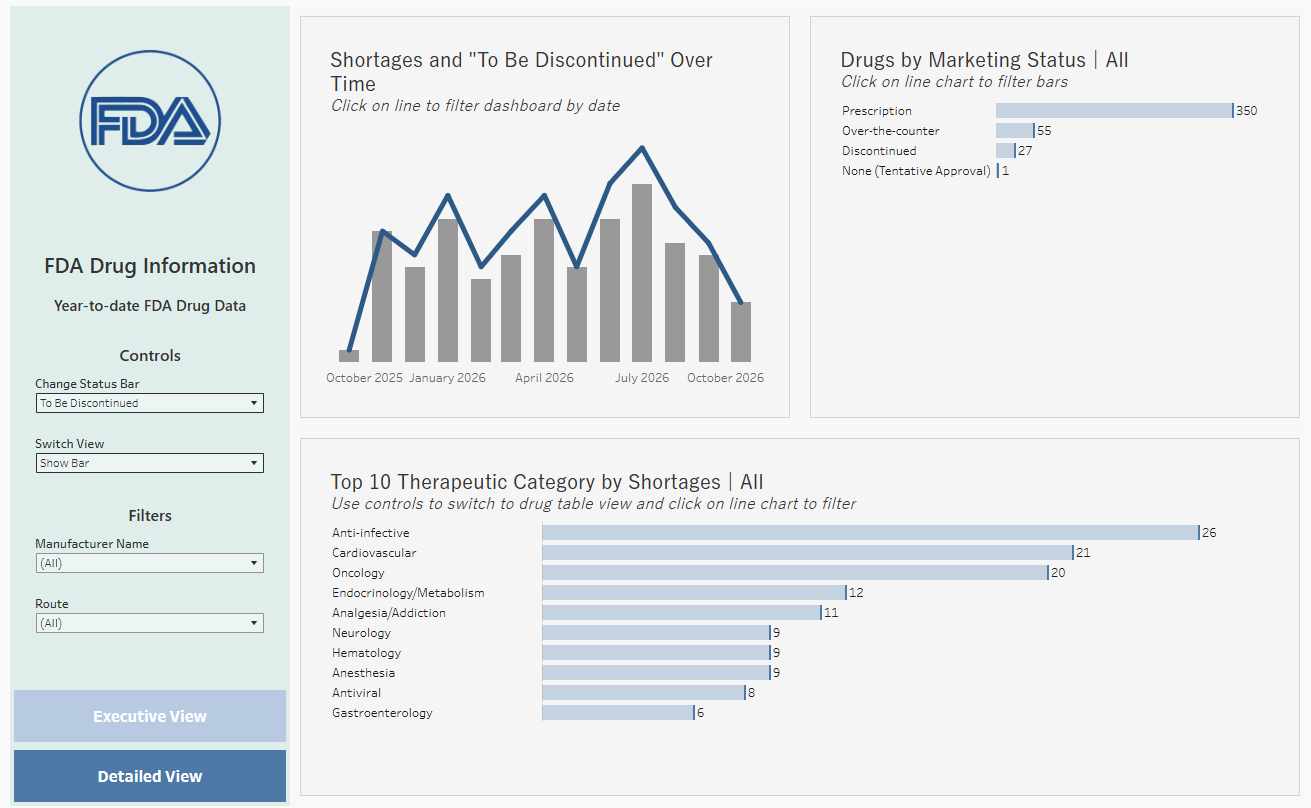
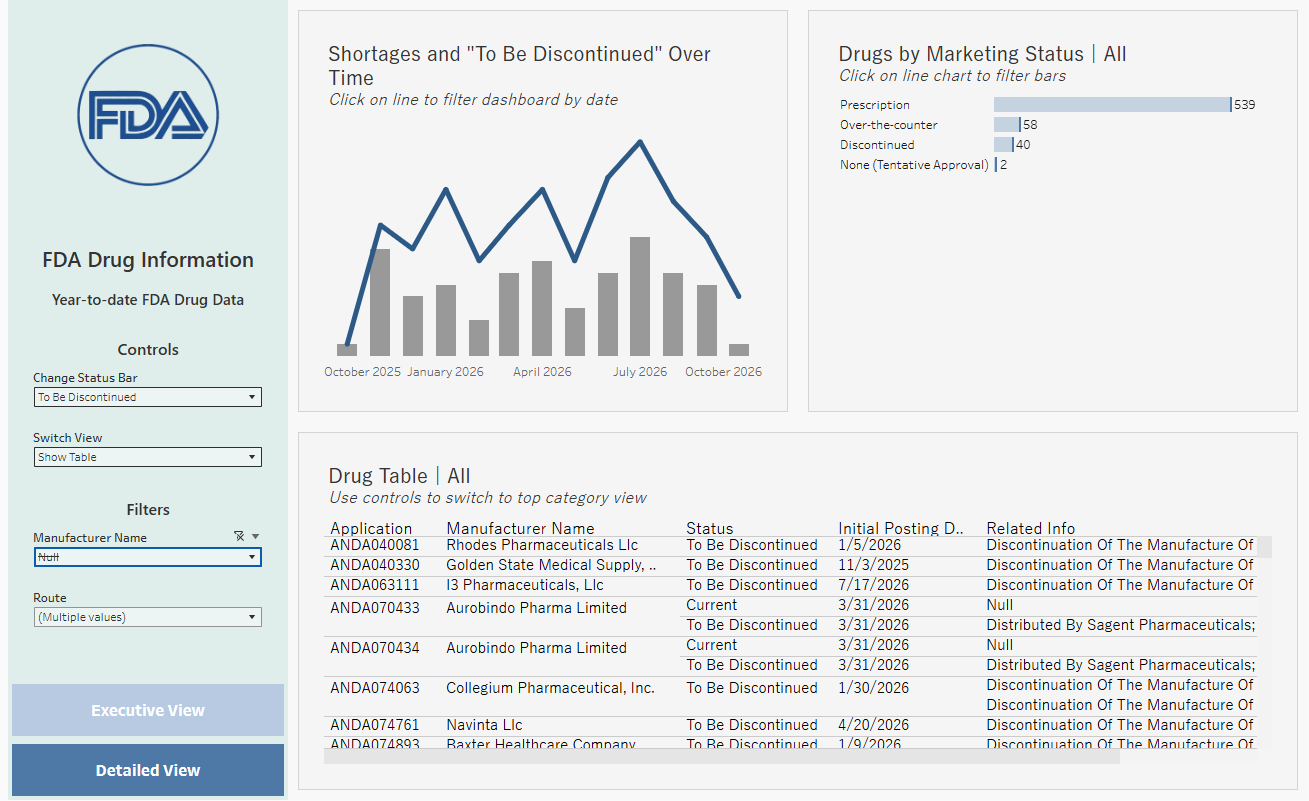
The detailed view allows an analyst to explore shortages. The first chart compares shortages to the selected drug status, either "To Be Discontinued" drugs or "Limited drugs", allowing for the takeaway that most shortages are due to discontinuations. The line on the first chart also filters the other charts by date, allowing an exploration of the marketing status of the drugs on the selected date, and therapeutic categories. Additionally, the last chart on the bottom can be switched to a table, allowing for row-level detail of the relevant submission application.