


If you were intrigued by my recent post on image-based scatter plots but aren't sure how to build them yourself, I have the perfect tool for you!
I’ve adapted my original Python logic into a JavaScript-powered web tool: ImagePlotter. I built this to speed up and democratize the conversion process because I believe everyone deserves the ability to turn visuals into data.
What can you do with ImagePlotter?
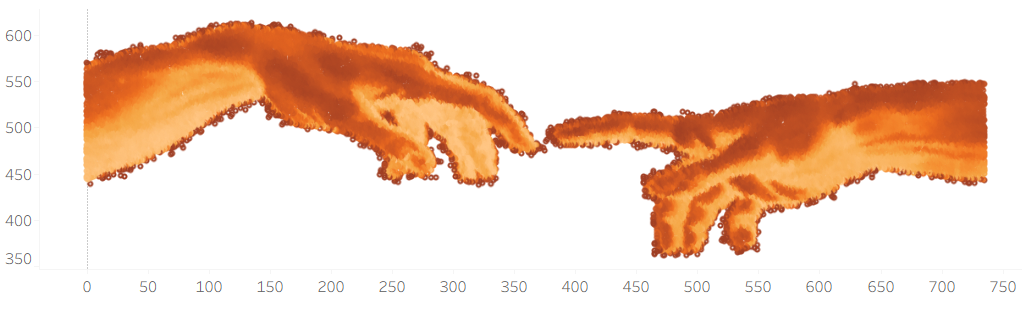
Beyond simple data extraction, this tool opens up a world of creative and analytical possibilities. From a data visualization perspective, you could design scatter plots where thousands of tiny points form a recognizable portrait or logo. These points could then be joined with another dataset so that each point represents a value in your data.
How it Works
The interface is designed to be intuitive and flexible. Once you upload an image, you can:
- Define your density: Specify exactly how many points you want to sample.
- Filter the noise: Set a cutoff threshold to automatically ignore background pixels or lighter values.
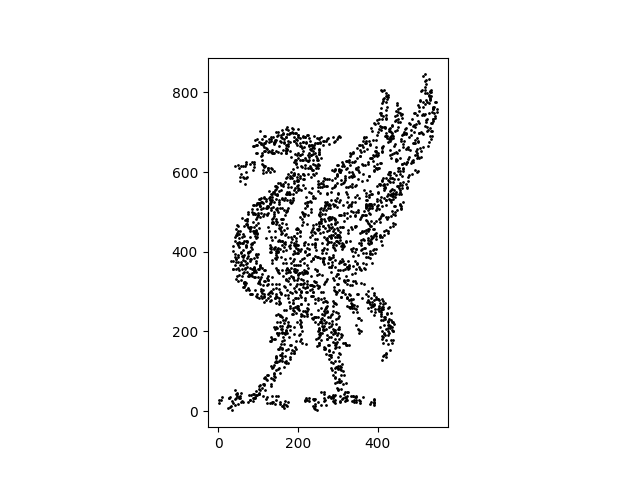
- Customize your output: Choose to export full intensity data or just the x, y coordinates if that’s all your project requires/you're working with a single color logo or silhouette.
Fine tune your results and rerun to achieve your desired output!
Explore the site here:
Pro-Tip for Best Results
ImagePlotter performs best with images that have a white or transparent background. This ensures the algorithm focuses on the subject of your image rather than the empty space around it.
Additionally, if you are visualizing in Tableau you will have to reverse the color in order to avoid an inverted image.
N.B. The csv file that you download will be title go_liverpool.csv
Get creative and happy vizzing!