


The days go on and the dashboards pile up as we hit our penultimate day of dashboard week at the information lab.
Powering Through: Tableau to Power BI Migrations (or Intro to Power BI)
I considered calling this blog Powering Up: Tableau to Power BI Migrations but I believe that "powering through" is a more accurate reflection of the learning curve.
Today we took a detour from our beloved Tableau to tackle an exciting Power BI challenge and explore some new skills. We've spent just under 2 days exploring Power BI during the training and so this was going to be pushing us well out of our comfort zone. The challenge was to convert, or begin the process of converting, a complex Tableau report to function in Power BI. Given the challenge of this task the trick was not only to work on building the new report, but also to scope out the project and consider how to present incomplete work at the end of the day. What should be prioritized in this limited time frame? Additionally, the underlying data for the Tableau reports isn't available to we had to extract it in order to rebuild the report in Power BI.
I chose to work on migrating Ellen Blackburn's Project Pipeline Report.
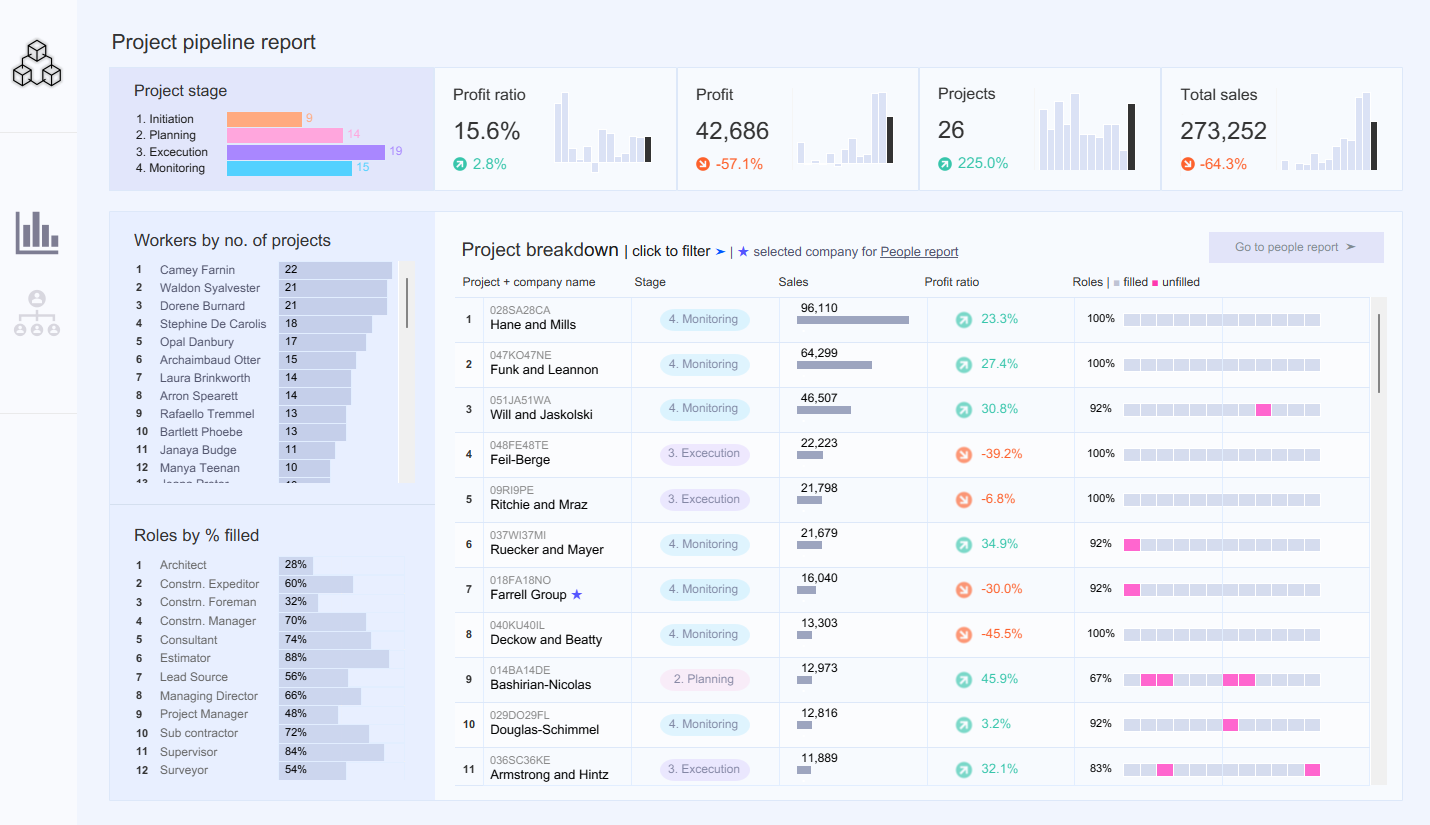
Given the amount of bar charts I initially expected a fairly simple translation process. However, as I dove deeper into the data I realized that there were far more complex calculations at work.
Planning the Process
I started out with a simple 5 step plan to break out the day, plus allocating time for blogging and presentation practice. I knew I wanted to complete all these steps and that would require not going as deep as would be optimal for each one.
- Familiarize myself with the original report
- Export the data and start modeling in Power BI
- Recreate calculated fields in Power BI, translating from Tableau syntax to DAX
- Build initial charts and explore formatting
- Identify limitations and begin to scope work around
Using this as my outline for the day I was able to dedicate some time to each of these considerations, allowing me to gain a solid overview of what this process would look like in order to present a thorough report at the end of the day.
Understanding the Origins
In order to migrate the report I had to first understand how it was build and how it functioned. While I was able to open up the data source tab I could see in the data pane that it used two different tables and had many calculated fields bridging them as well as multiple sets and parameters.
Exporting the Data
Since the data wasn't directly accessible I had to manually download the tables as two csvs from the workbook.
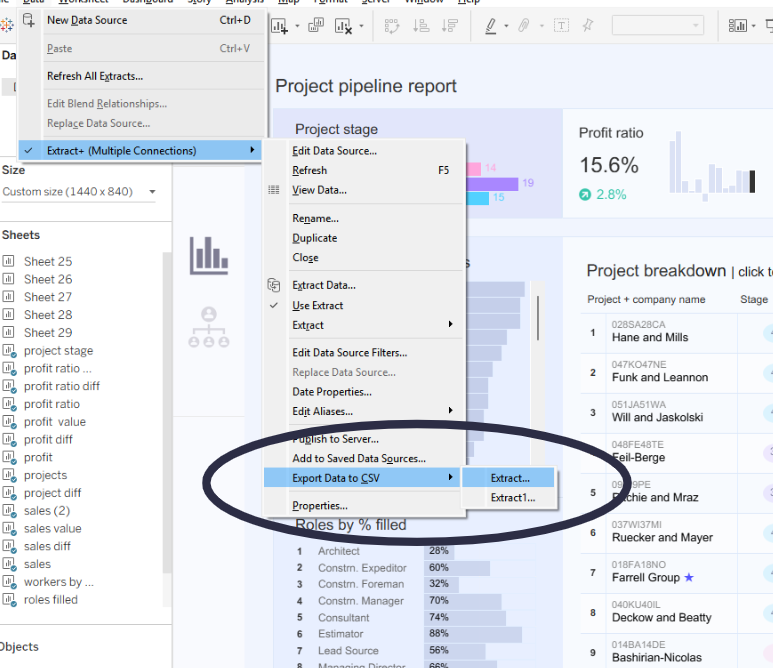
Once I had these I was able to upload them to PowerBI and see how the connected. Seeing the raw underlying data also reminded me just how many calculated fields there were and so I braced myself for a busy day.
Data Modelling in Power BI
One of the biggest differences, to me, between Tableau and Power BI is how the data is structured. While Tableau will automatically relate different tables without specifying cardinality, direction, or whether the relationship is "Active" or not, Power BI allows you not only to do all of that, but also for the nature of the relationships to vary depending on the calculation being performed. This level of specificity can be frustrating when you're used to not thinking about it, but also allows far more control and precision if the calculations require it.
Power BI also handles date calculations best when you use an external date table, and ideally a separate measures on as well.
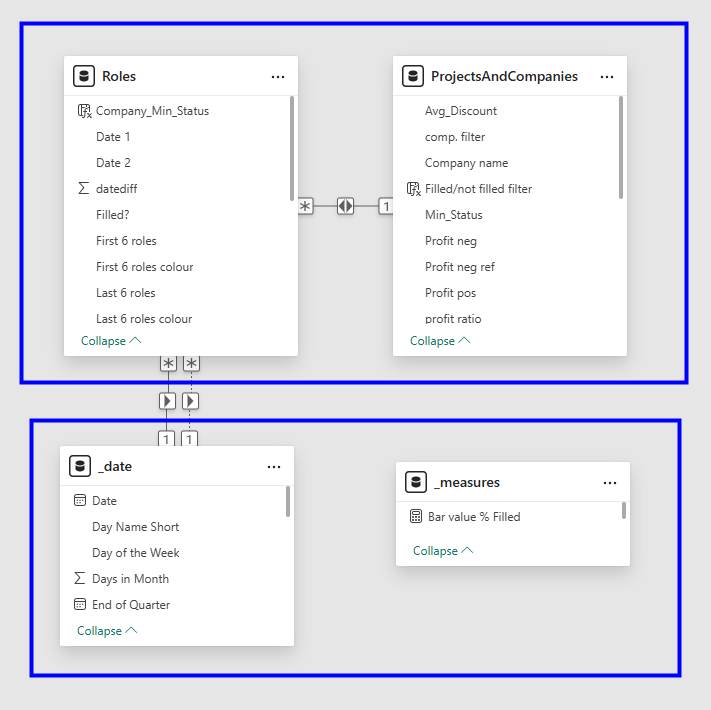
I brought in and related my two tables from the original dashboard and then created two more to store my dates and measures.
Power BI also allows you to differentiate between calculated fields that are stored as new columns in a table and measures which are calculations that can summarize or aggregate data quickly since they aren't directly stored in memory.
Translating the Calculations
Translating calculations definitely gave me the most difficulty as functions such as LODs don't have direct equivalents in Power BI and the dynamic nature of relationships between tables means that you have to put more thought into where the data is coming from for each calculations.
Some of my key concerns and goals in this area were as follows.
- Defining relationships
- Understanding dates
- Beware of aliases
- Converting LODs
- Planning for parameters
- Adapting sets
Building the Charts and Formatting
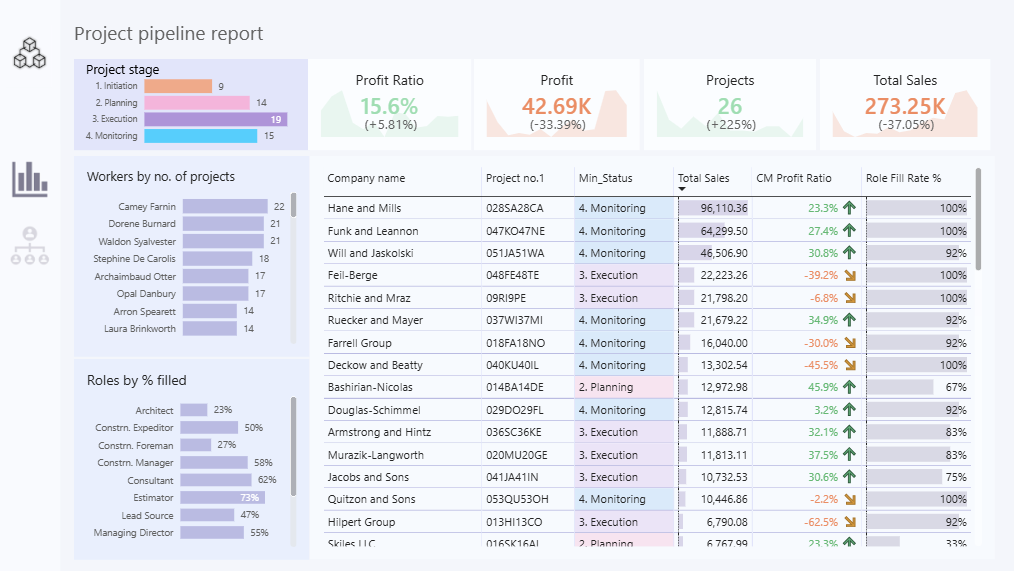
My final outcome was far better than I expected at the beginning of the day, but still a stark reminder of the limitation of Power BI when adapting Tableau materials. Certain elements, such as the KPIs would have been possible to adapt more closely given more time, while others, such as some of the details in the table, are simply not feasible in the Power BI Software.
Limitations and Workarounds
Some of the more advanced set and parameter actions gave me more trouble and so I decided to dedicate more time to researching how other people have handled those issues in order to determine what would be doable and what would need to be adapted differently.
I've definitely sharpened my Power BI skills today and will continue to reflect on what is possible to adapt from Tableau. TIL tomorrow!