


Another day another dashboard is the name of the game this week at The Information Lab. Today's challenge was to use Alteryx to web scrape recipes from The Great British Bakeoff website and then build a dashboard.
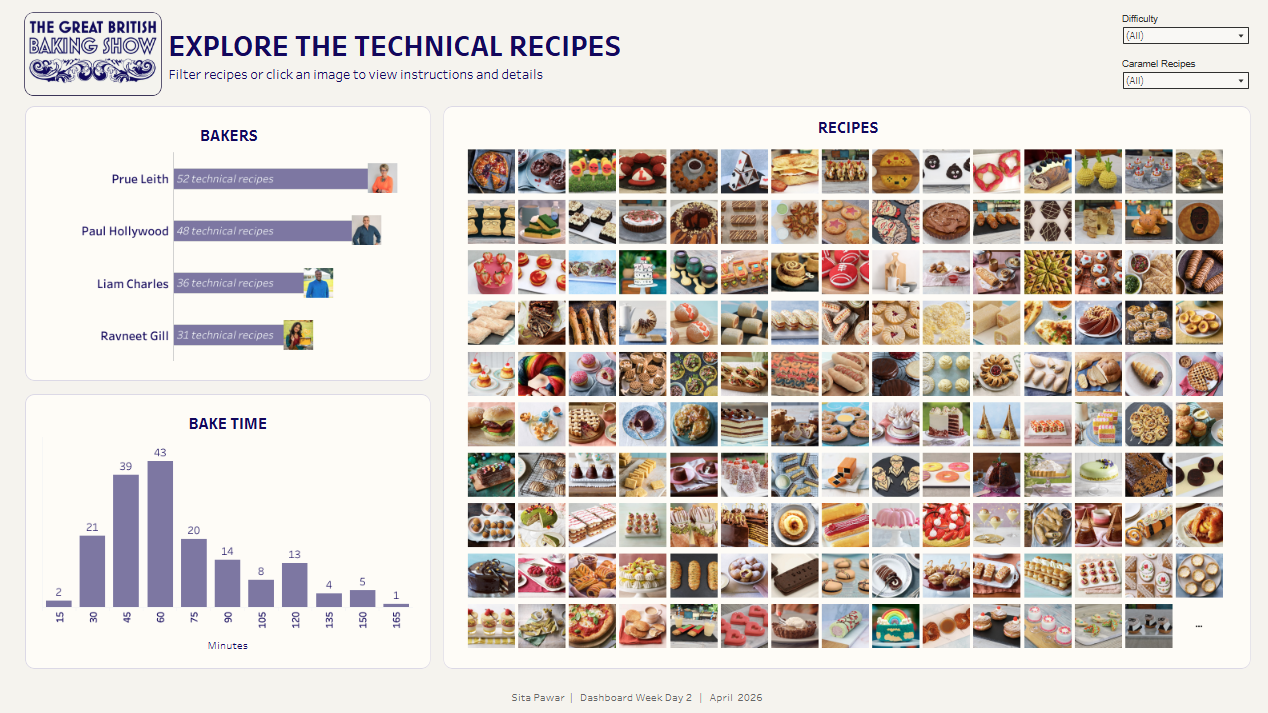
I decided to focus on technical recipes and built a dashboard that allows you to see images of each recipe, a time histogram, as well as the breakdown by baker. When publishing to Tableau public I took advantage of the new rounded corners feature which was delightful.
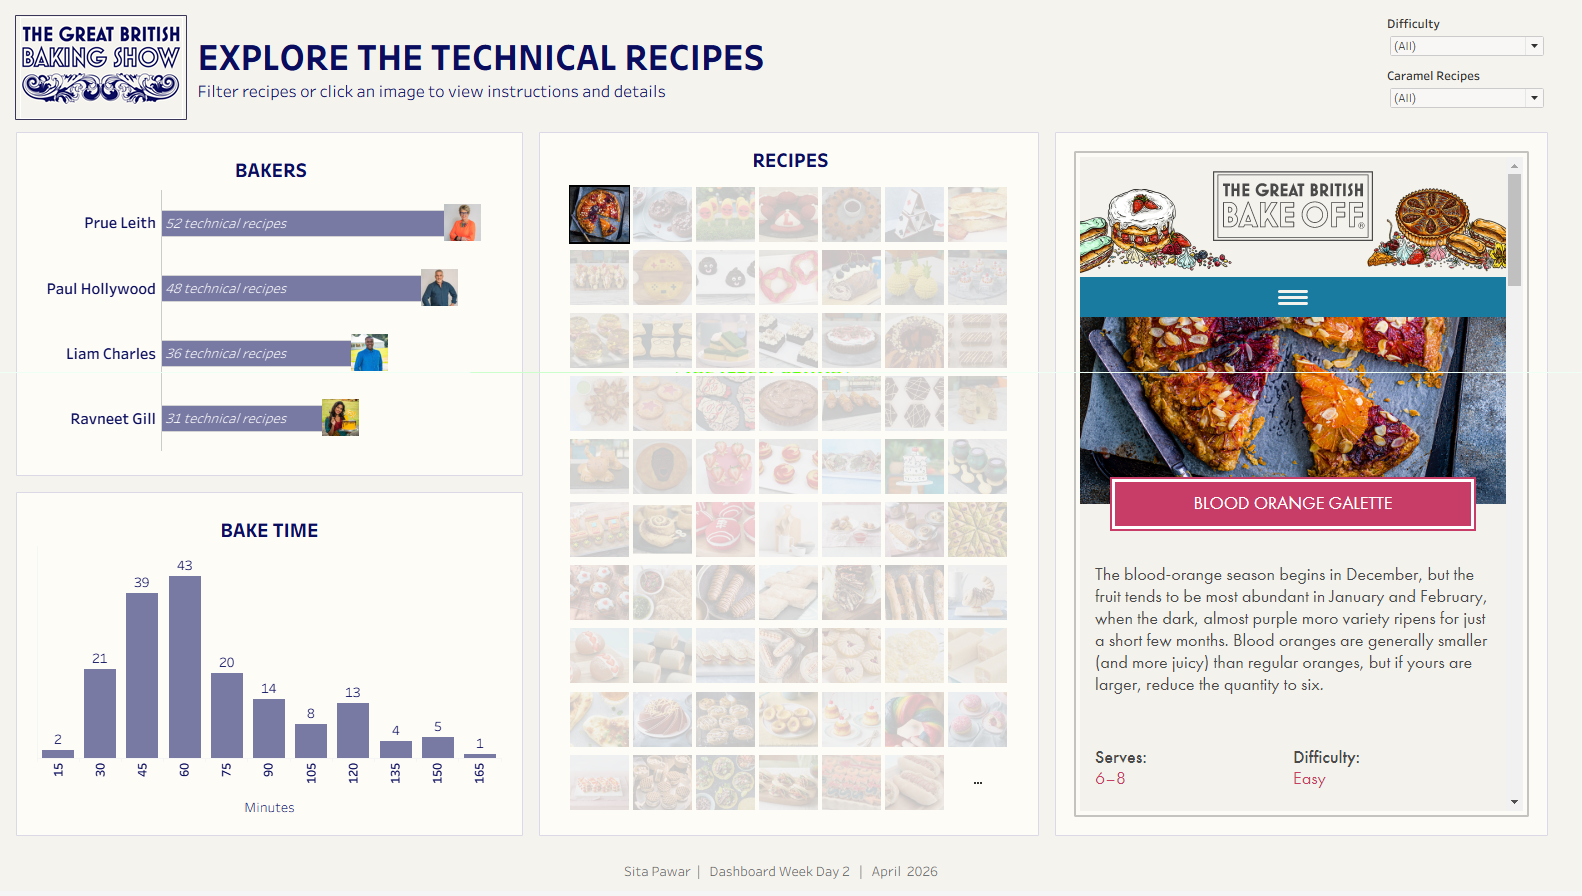
The day started by building out an Alteryx API flow to download the image from https://thegreatbritishbakeoff.co.uk/recipes/ and then parse it out into readable columns.
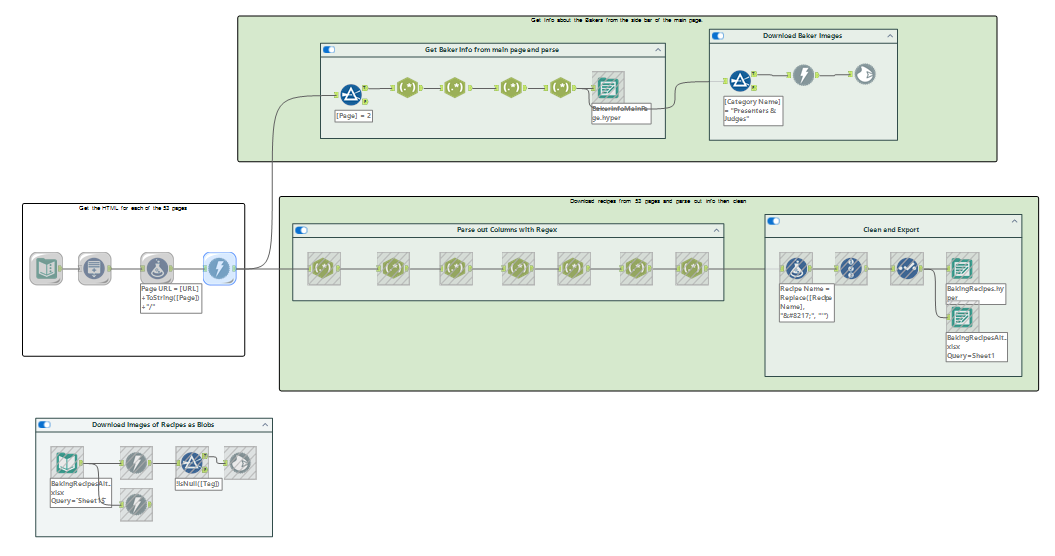
I used Alteryx's download tool to take the HTML from all 53 pages of recipes by combining a generate rows tool with the text input of the bar URL. Then I use the regex tool to tokenize the divs for each recipe into their own row and then I used regex's parse function to grab the info I wanted for each of my columns. While I technically could have done this in fewer steps than I used, it was easier to break up the regex rather than come up with one massive catchall for every piece of info that I wanted.
I knew I wanted to include images in my dashboard so I also created flows to download images of the bakers and all the technical recipes that would allow me to download the image as a blob and then use Alteryx's blob output tool to download them locally. Feeling grateful to Robbin for his Dashboard week blog that guided my process.
Check out my final dashboard on tableau public and I'll be back tomorrow with more!