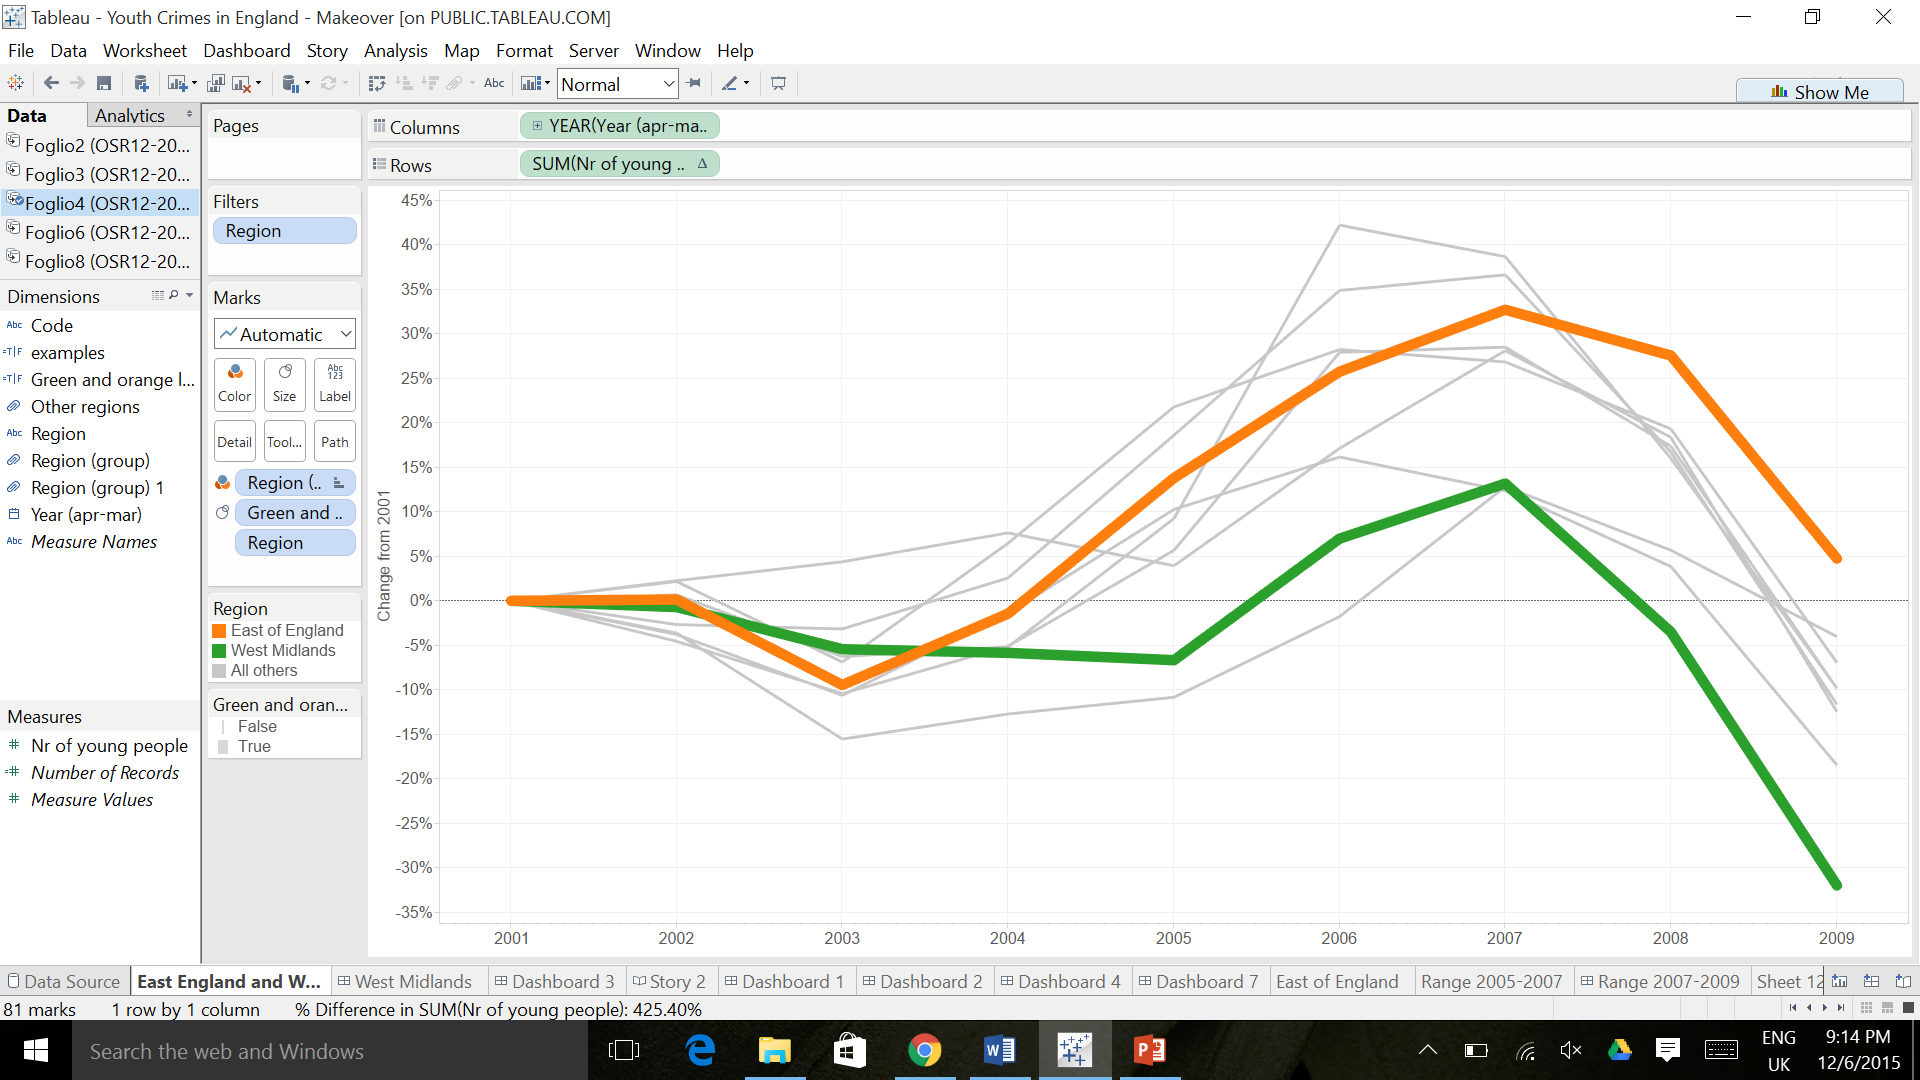
During the makeover of my very first Tableau viz, I learnt two different ways to highlight something in a line chart:
- The first one is using a reference band (very useful for selecting specific parts of the chart)
- The second one is highlighting specific lines of the chart.
REFERENCE LINES
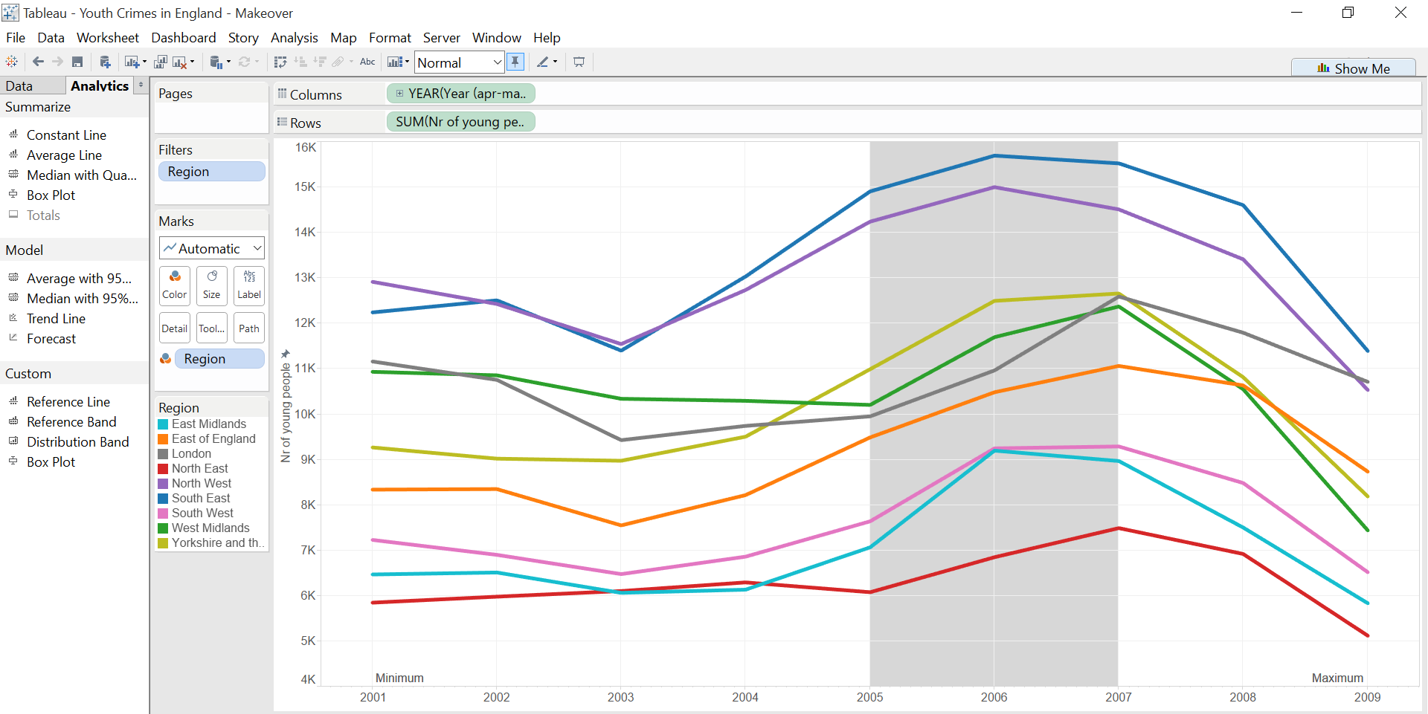
Suppose you want to highlight the area between 2005 and 2007 of the line chart below.
- In the Analytics section, drag and drop “Reference Band” over the graph, selecting Year and Table as shown:
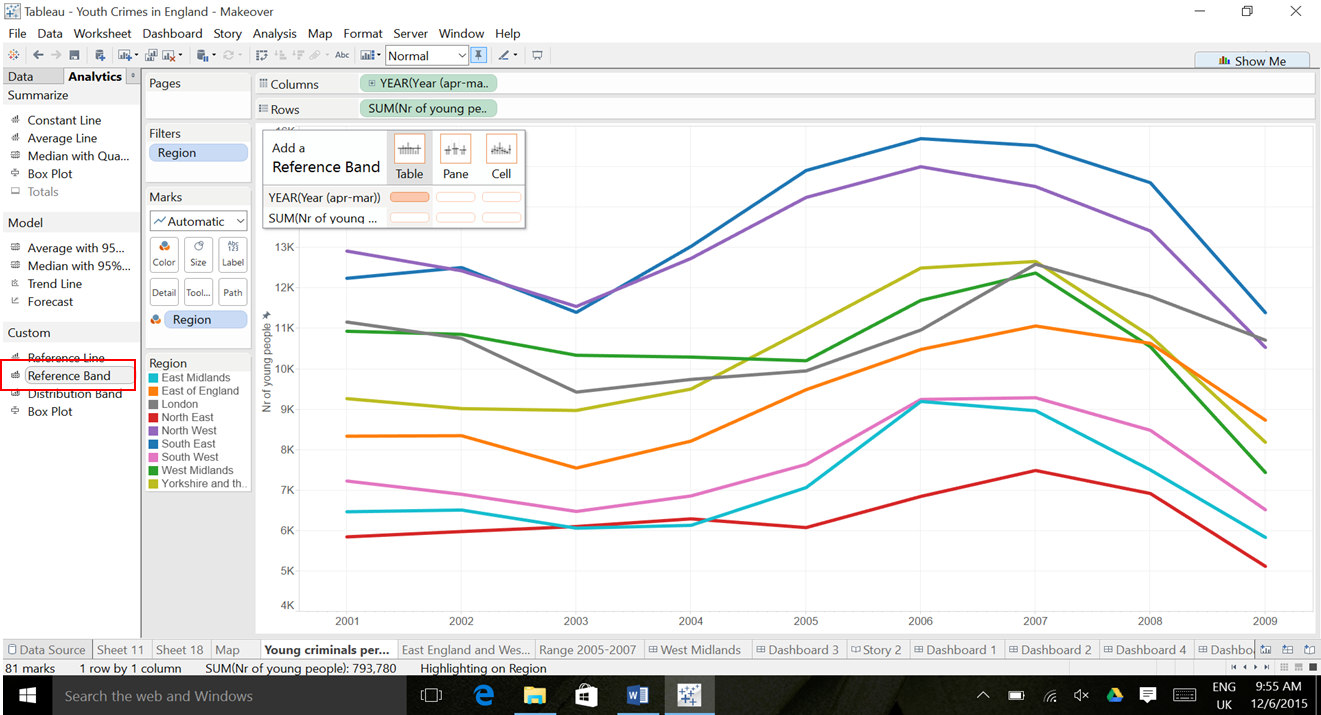
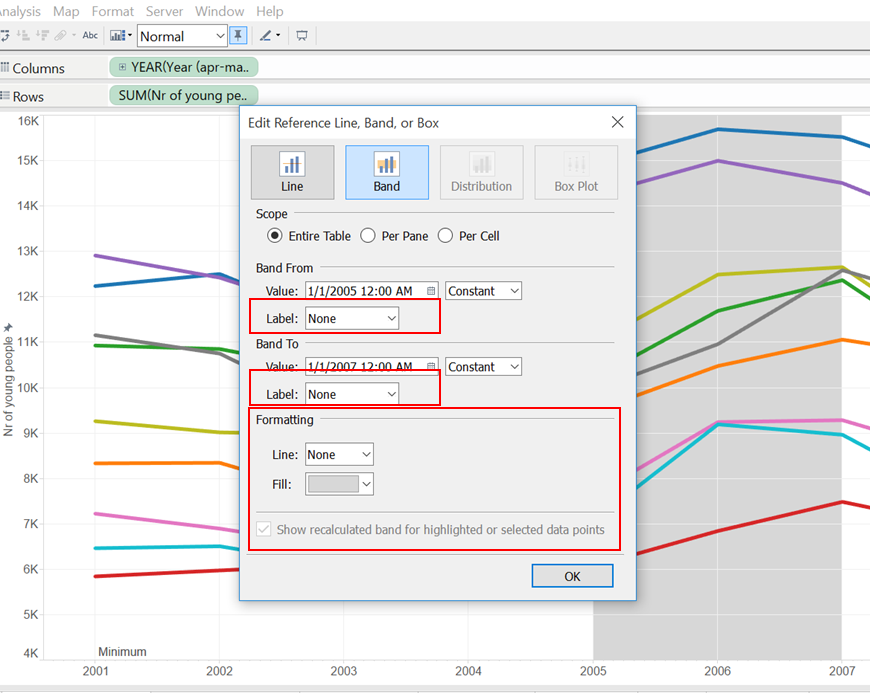
- A lightbox comes out, where you need to edit and define the characteristics of the reference band you want to create. After selecting “Band”, you need to set up the values band (from to) as “Constant” and the calendar
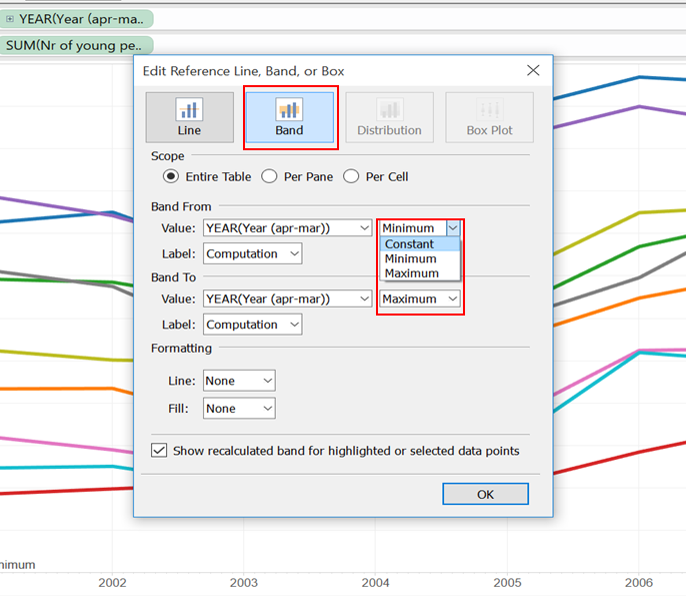
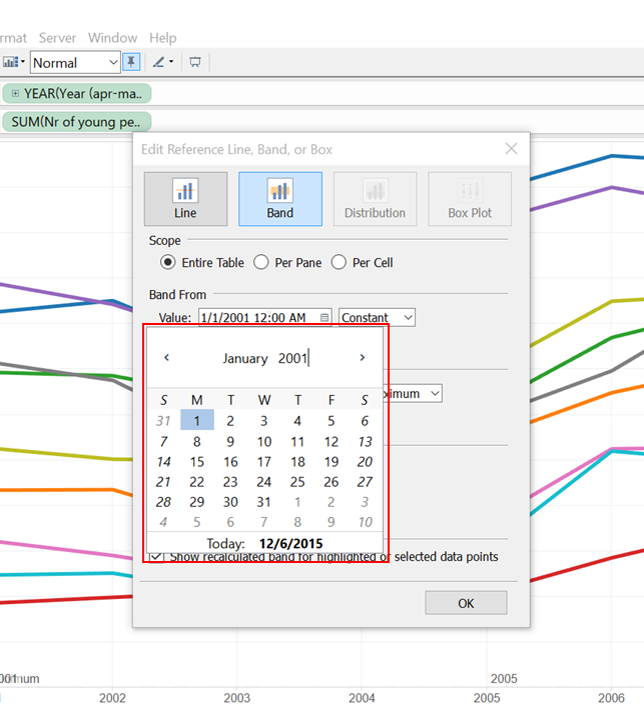
- Then, if you do not want any labels to appear on the chart, make sure to select none for “Label” and don’t forget to specify the formatting of the reference band before clicking on the “OK” button.
Voila’, your line chart with a reference band is done!
HIGHLIGHTING LINES
Suppose you want to highlight the orange and green line.

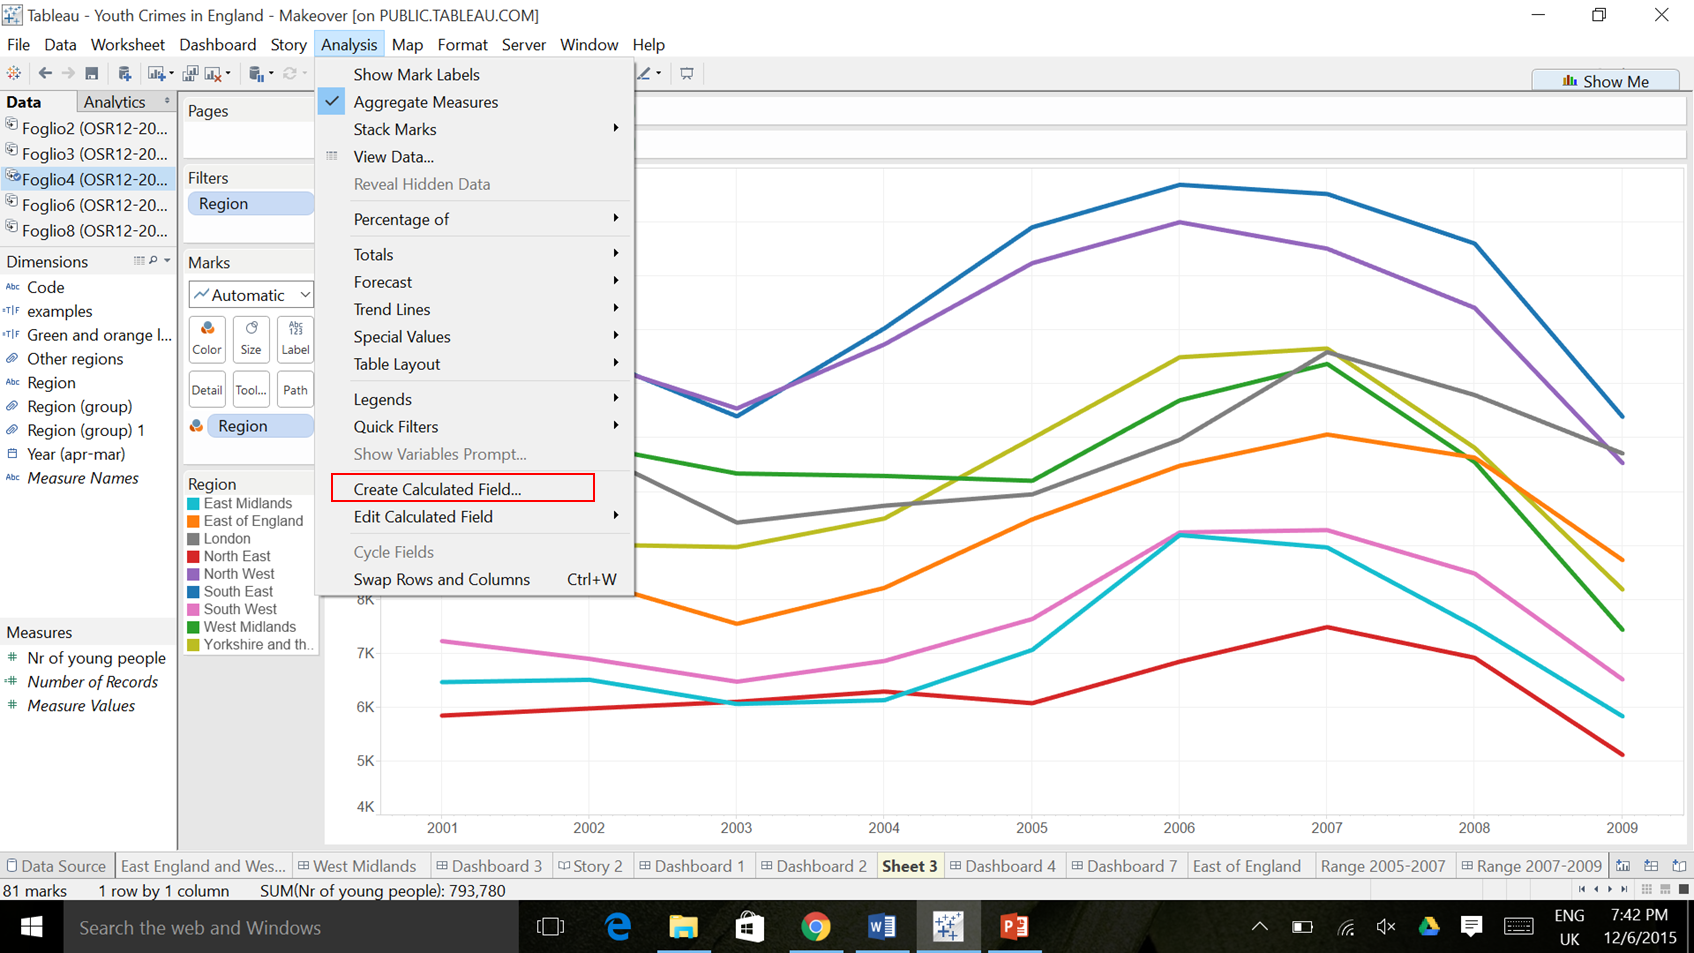
- First of all, you need to create a “Calculated field”
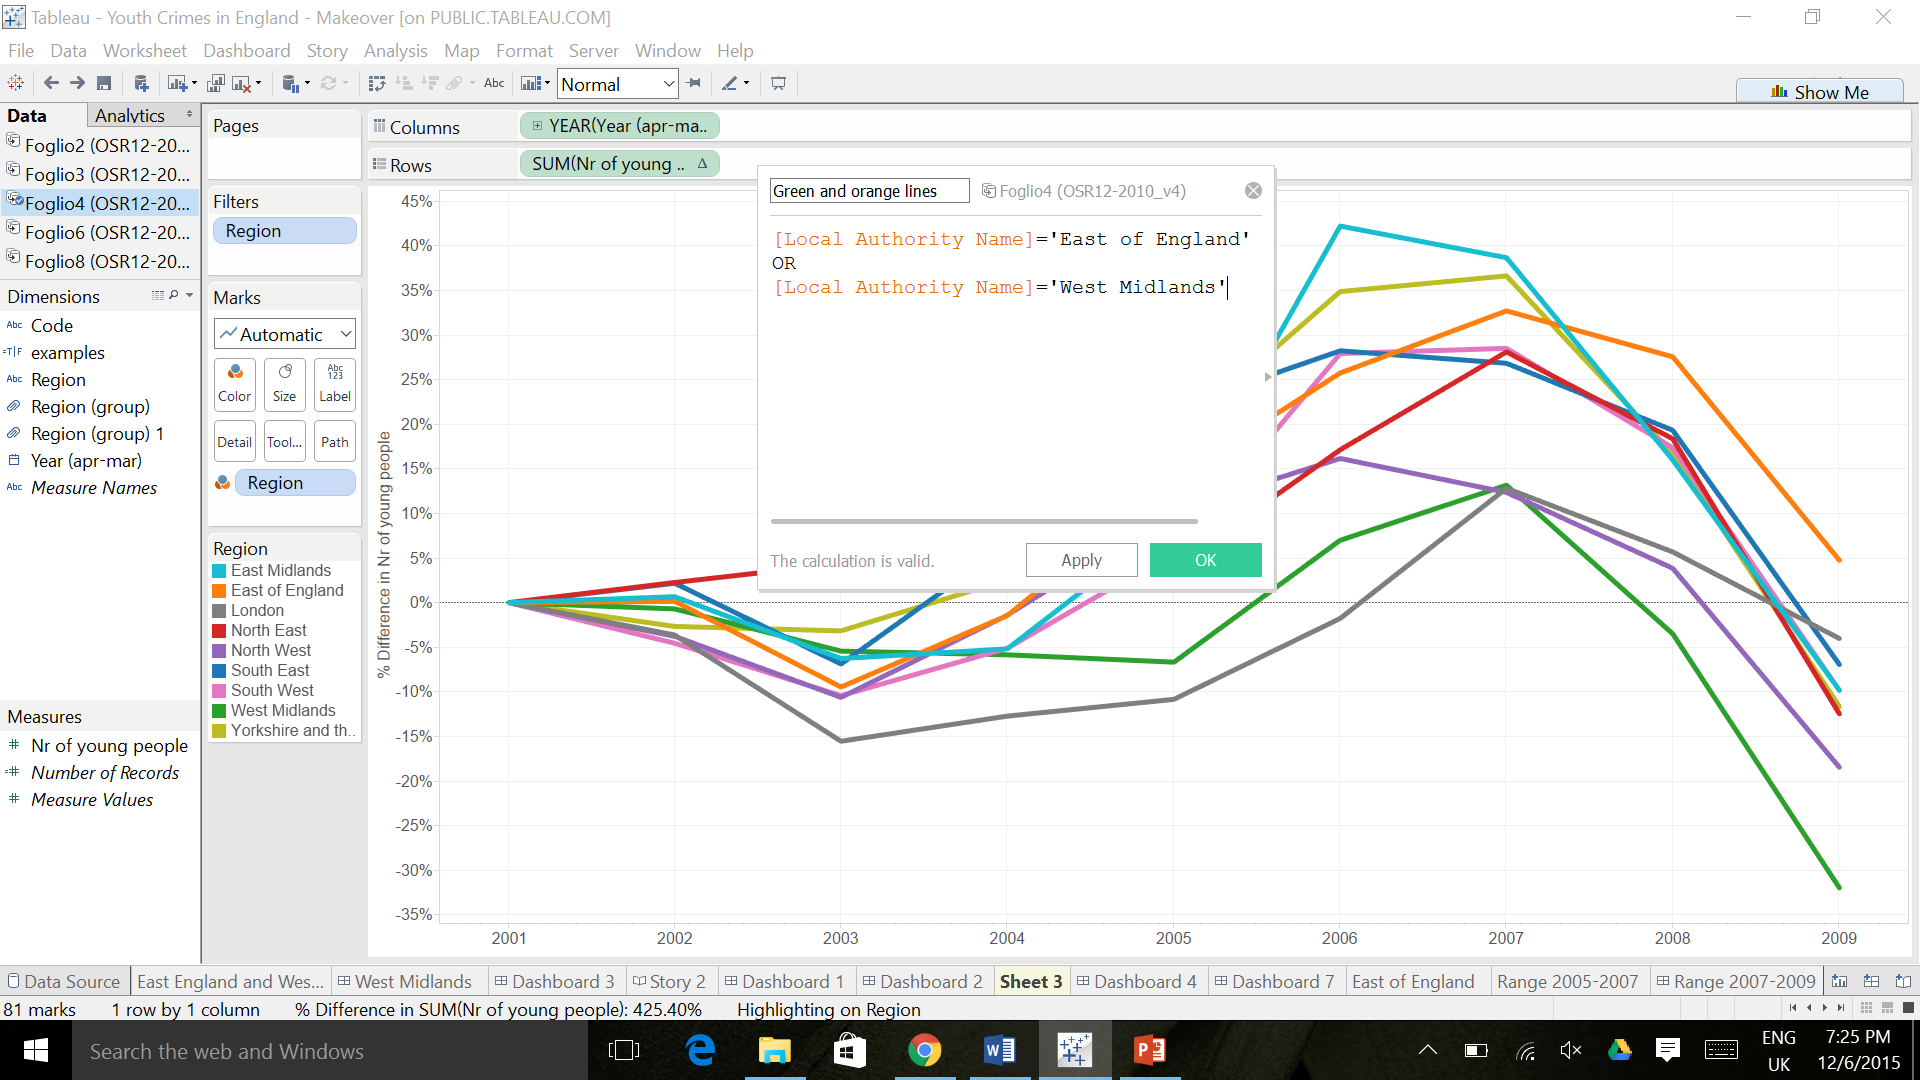
- Write the following code, which will allow you to highlight and size the green and orange lines:
- Select the other regions:
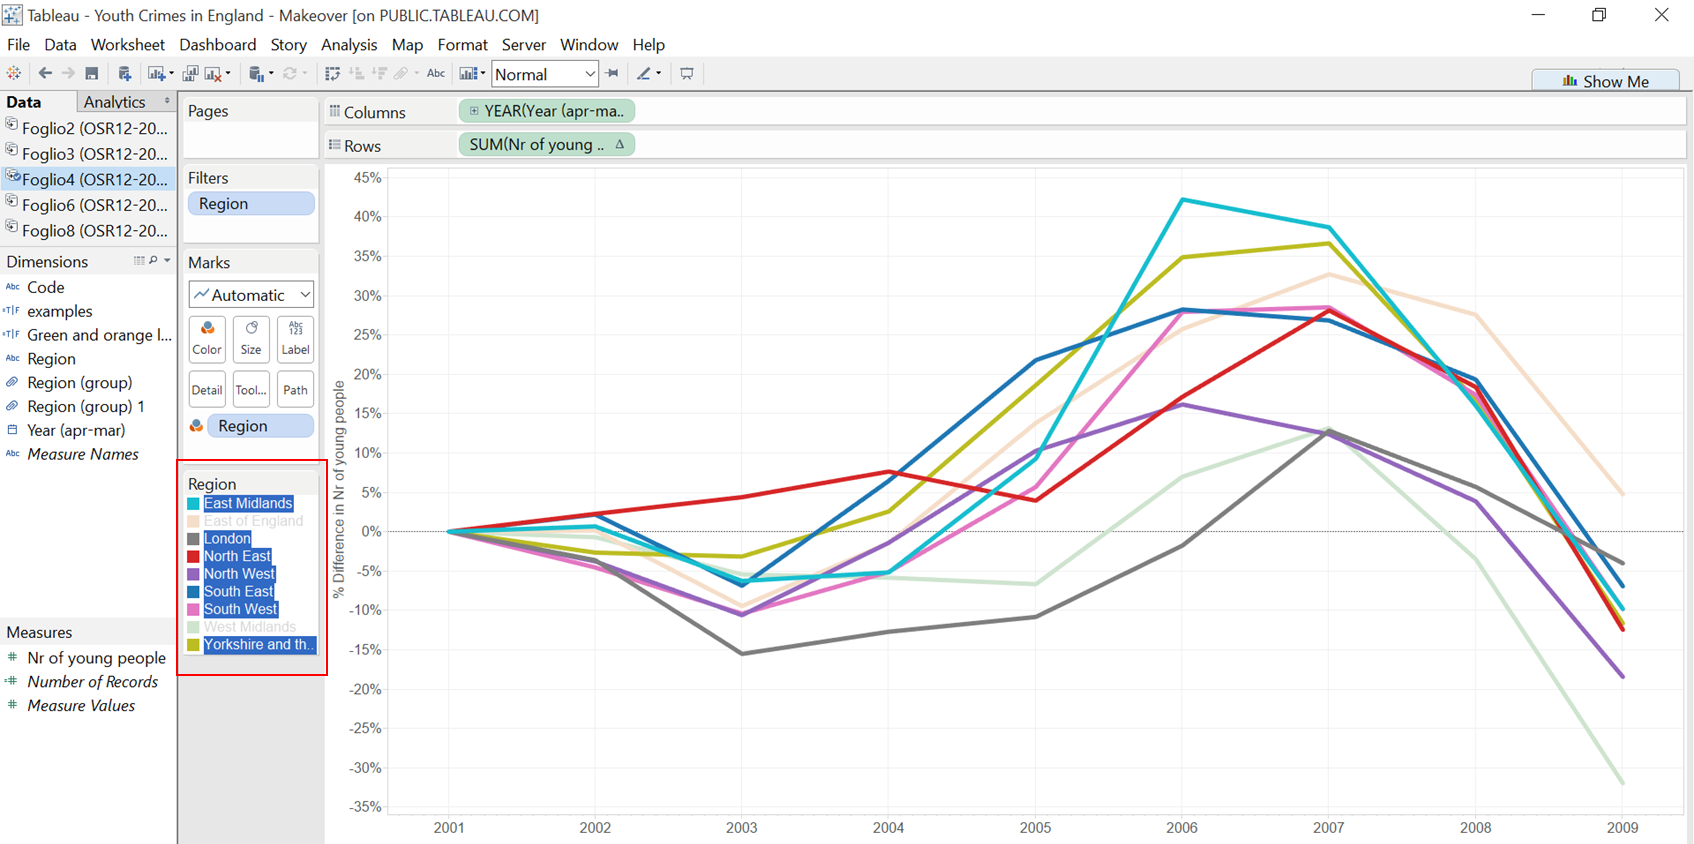
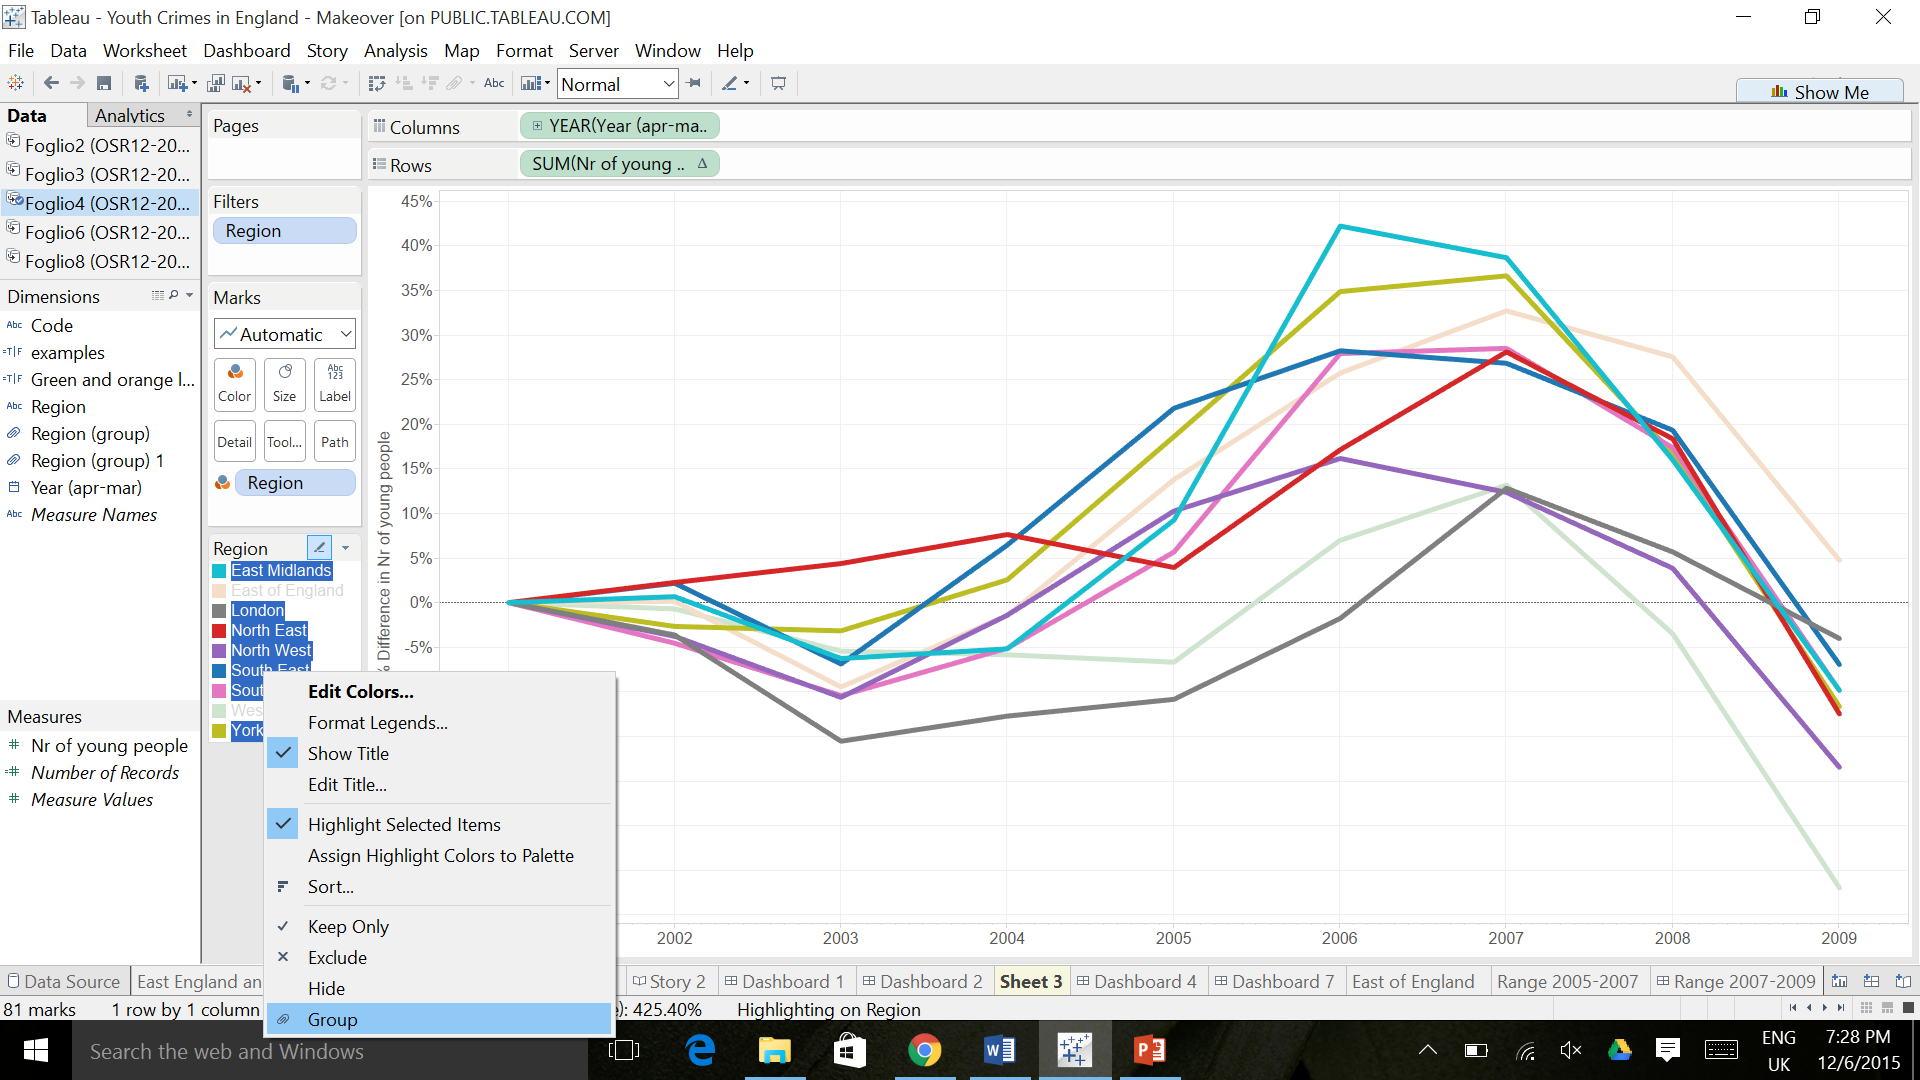
- Right click and select “Group” to create a group
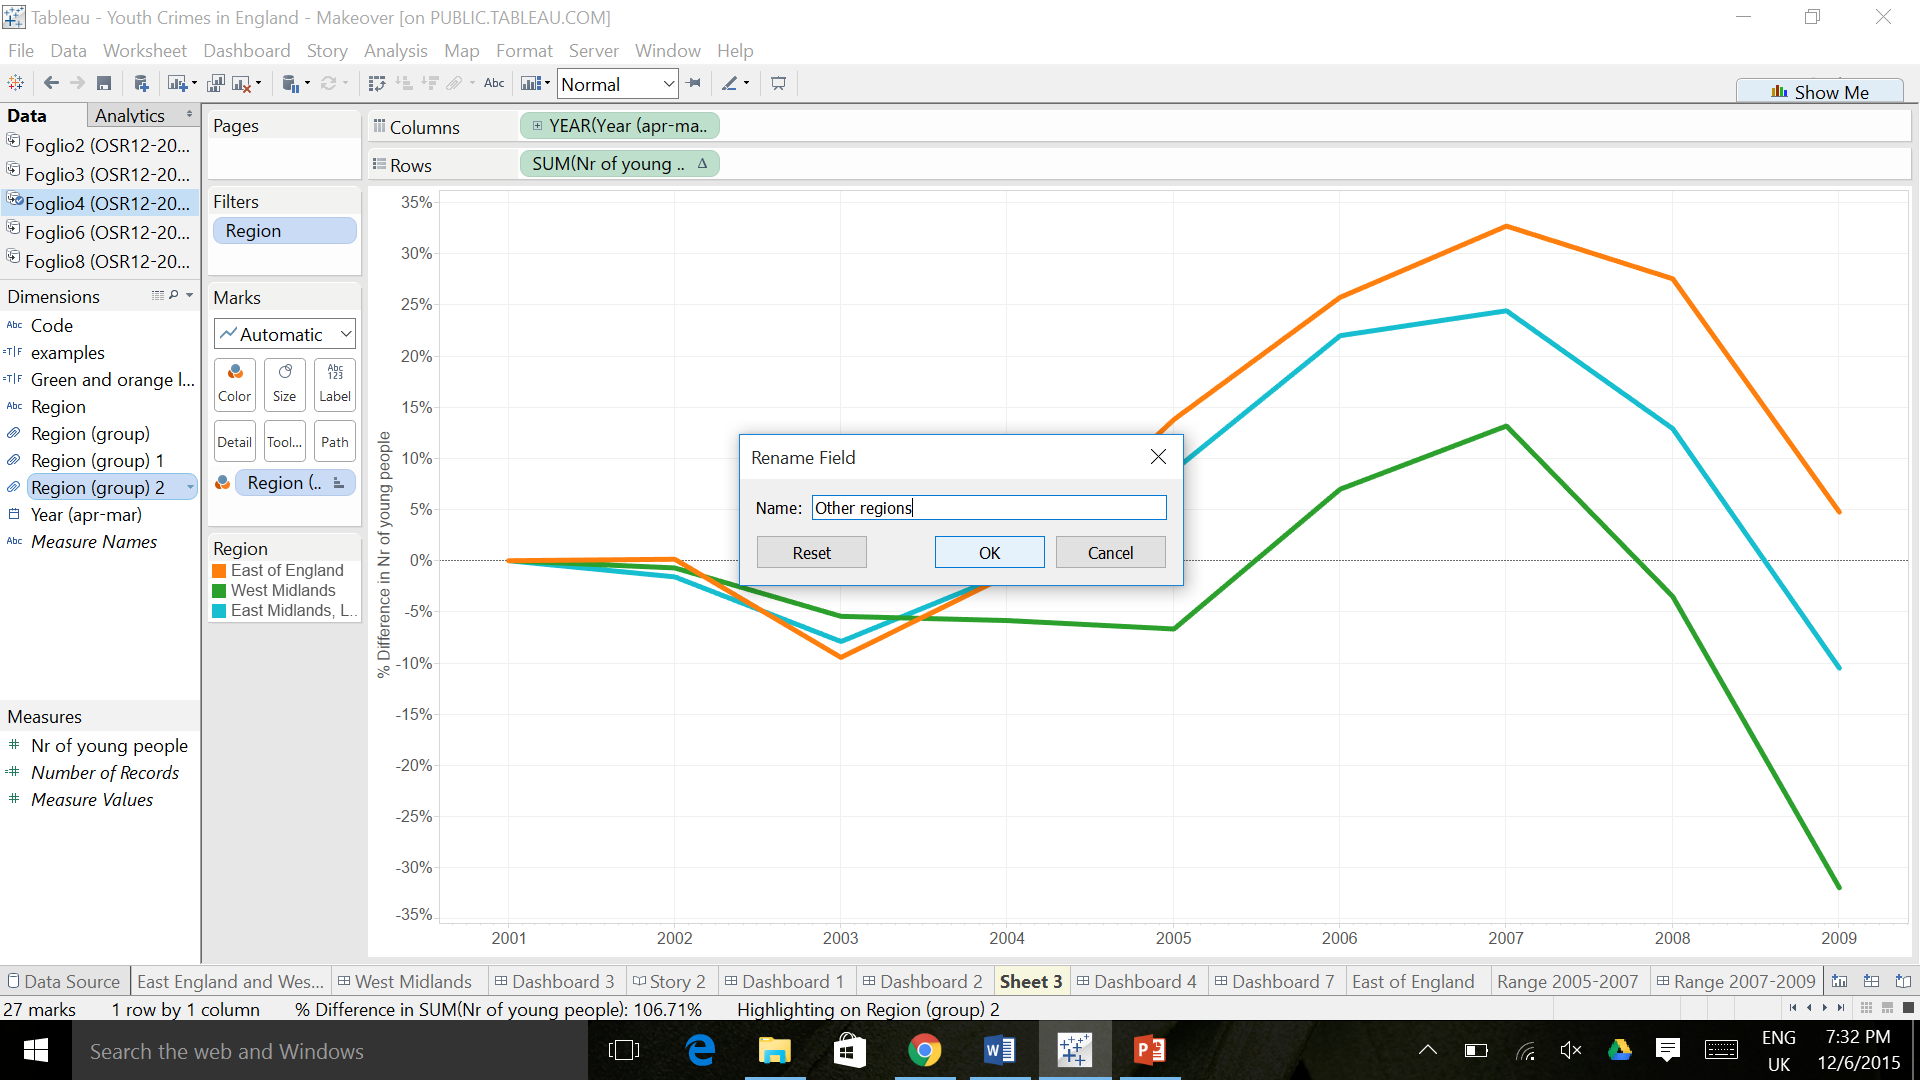
- To rename it, right click on the group and select “Rename”:
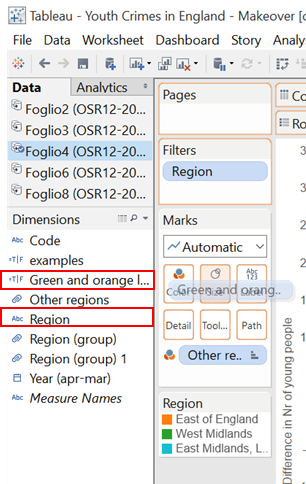
- In order to resize the green and orange lines, drag and drop the calculated field called “Green and orange lines” to “Size” and then “Region” to “Detail”
- Finally, it is only a matter of adjust the colors and the labels and that’s it, here the final graph is!

