I have decided to experiment sin and cos functions in Tableau and play a bit with them.
First of all, a bit of context of what I have done and some maths references about the circle equation & formulas.
STEP 1 – “HOME MADE” EXCEL WORKSHEET
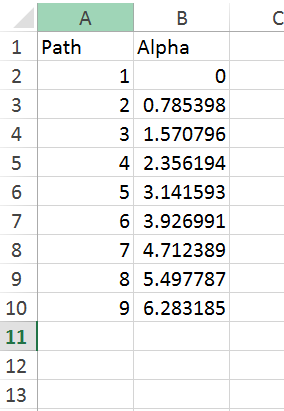
I have built a simple excel sheet with
- Path: basically an ID per row
- Alpha: angle, calculated with excel using the pi() function (for example, type pi()*1/4 to get an angle of 45 degrees)

STEP 2 – MATHS BEHIND THE SCENE
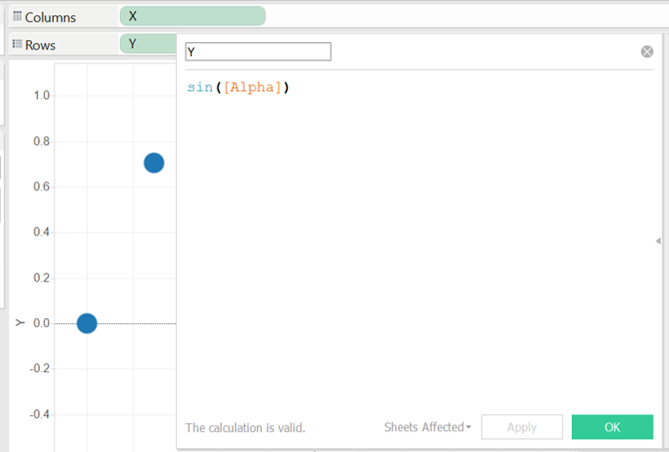
Consider the case of a circle with radius r=1 and center in C(x_0=0,y_0=0). After connecting Tableau to this dataset, create two calculated fields, X and Y:


Why these formulas?
A bit of mathematics about circle: the general formulas to calculate x and y are the following
- x=x_0+r*cos(alpha)
- y=y_0+r*sin(alpha)
In our case, the formulas will be simply (because we are supposing that r=1, C(0,0)):
- x=cos(alpha)
- y=sin(alpha).
STEP 3 – TABLEAU VIZ
And now, what can you viz?
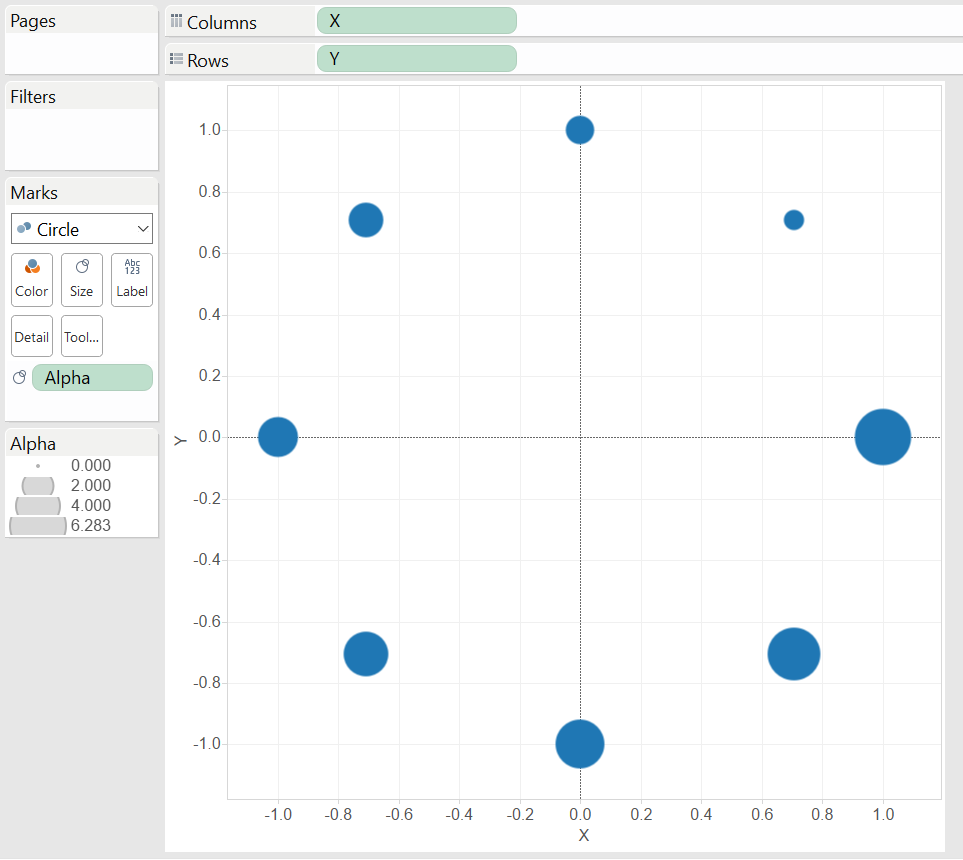
Drag X and Y into Columns and Rows (and if you want the angle Alpha into size), you will get:

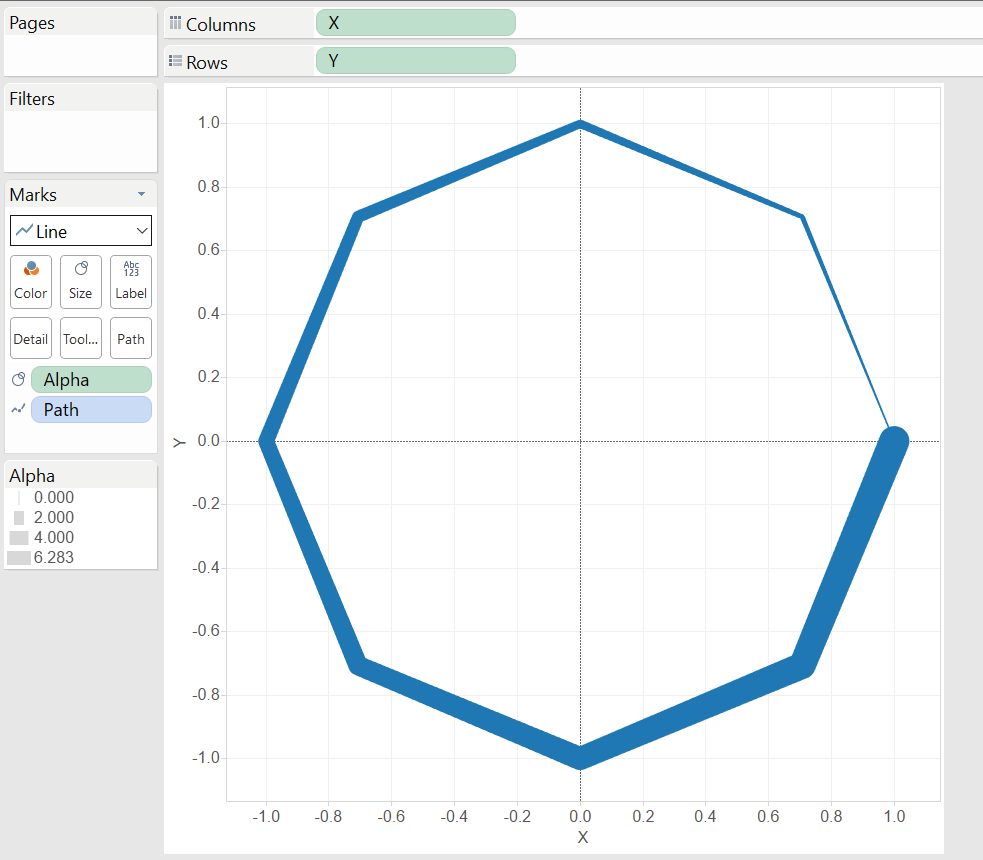
Now, if you switch to “line” in the mark field and add path to path, you will get an Octagon:

I hope you enjoy it.
A presto!
