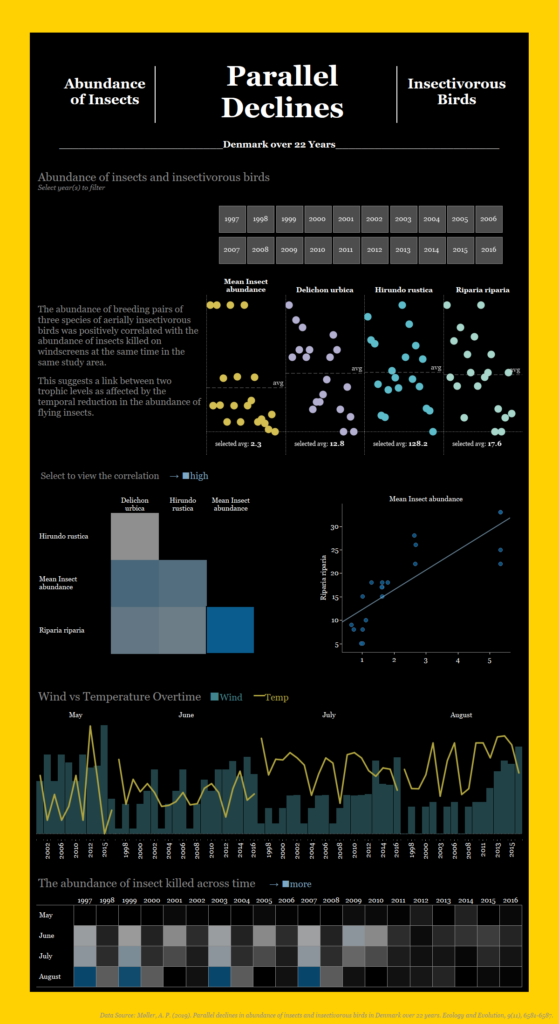
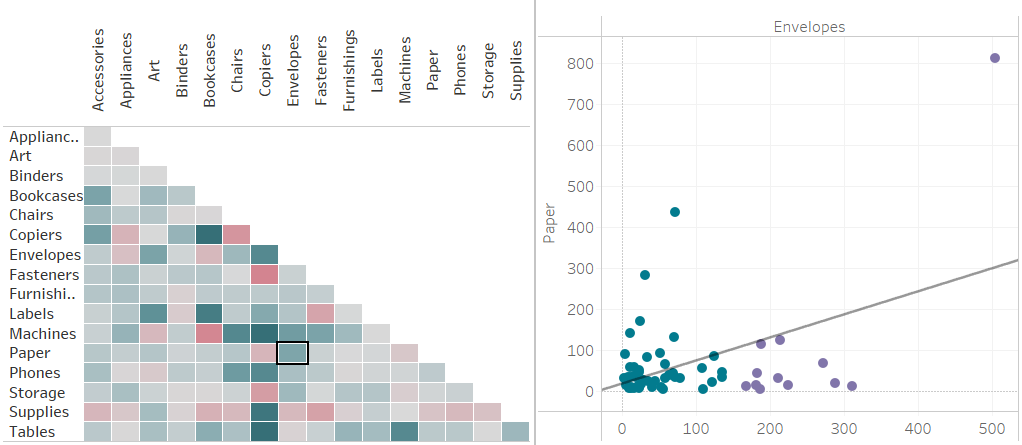
Brian in DS12 wrote a great blog post on how to make a correlation matrix in Tableau. It is a very useful chart type, and it is really cool that the cells in the matrix can be used as filters for the scatter plot of the two comparing categories. /brian-scally/how-to-make-a-correlation-matrix-in-tableau/
Normally a correlation matrix looks like this:
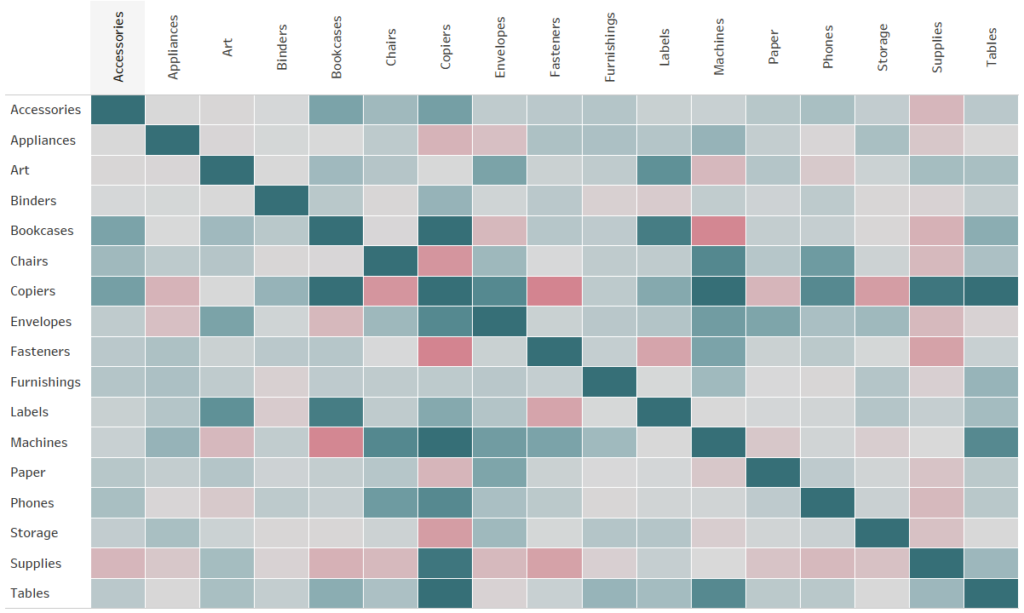
My question was how do I hide the top right half of the matrix (especially the diagonal), since the matrix itself is symmetric, the top right is basically repeating the information we’ve already had from the bottom left.
Step 1: Create a calculated field called index1; Create another calculated field called index2.
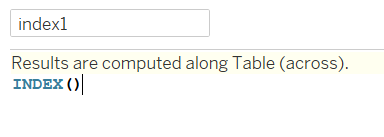
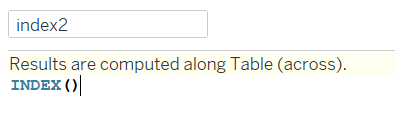
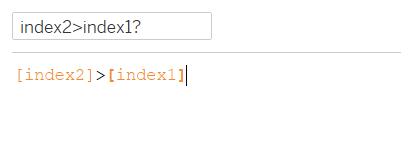
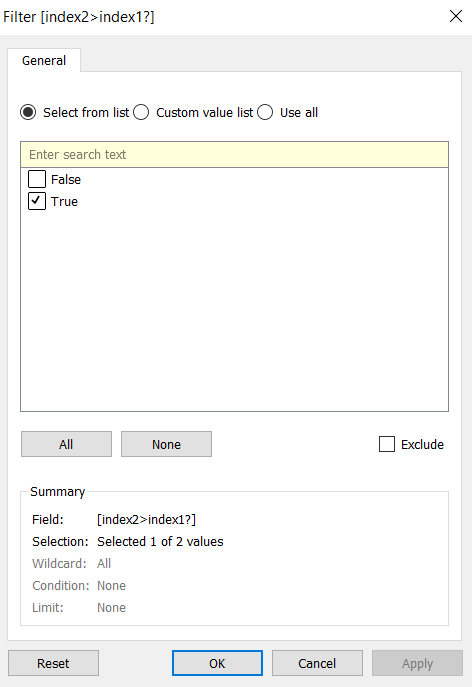
Step 2: Create a calculated field to compare index1 with index2; Put it on Filter, show only when values equal to True.
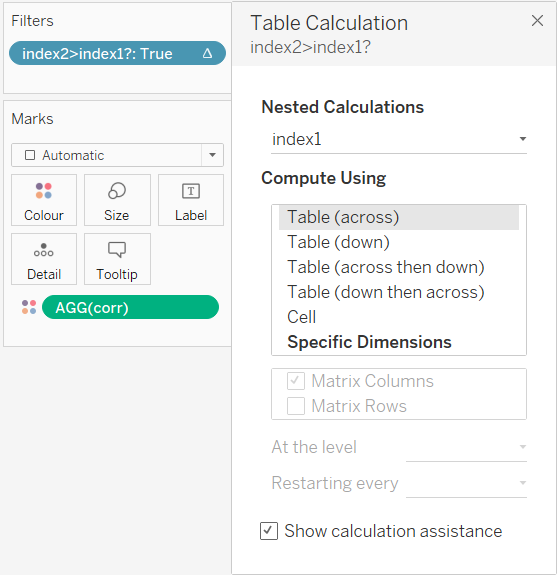
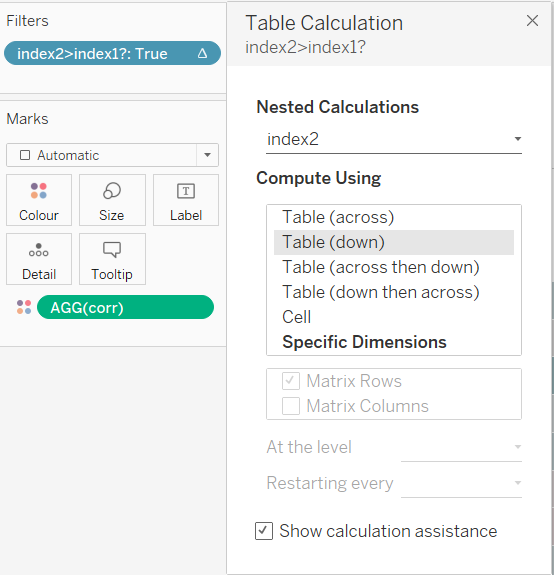
Step 3: Configure the Nested Calculations for index1, computing using Table across; Configure the Nested Calculations for index2, computing using Table down.
Now the symmetric half has gone!
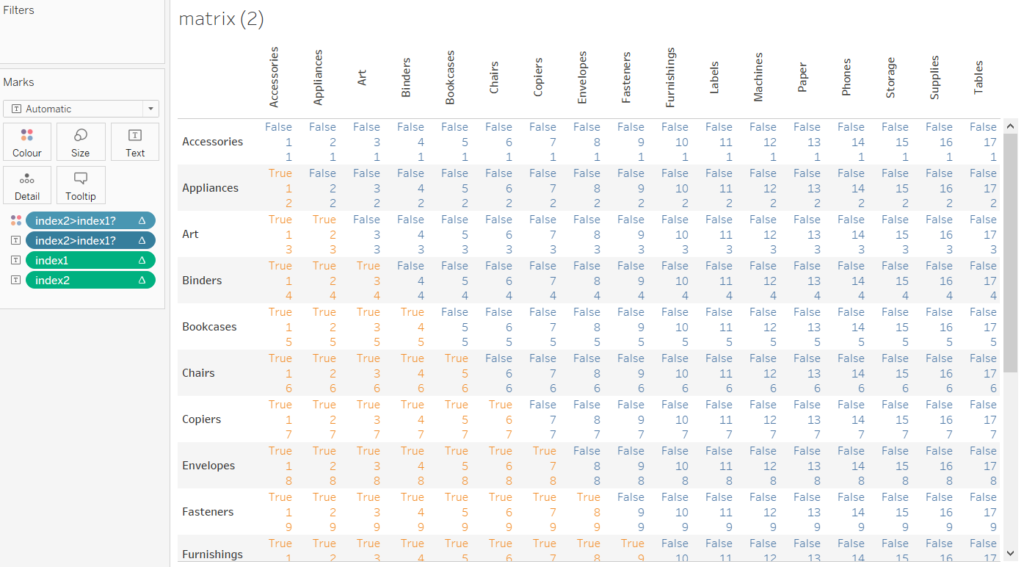
Want to know what is doing the trick? This table might help with your understanding:
Here is how I’ve used it on my dashboard for Dashboard Week Day4:
