I quite like this chart type we did with Andy, he calls it ‘Peas in a Pod’. I like the way it looks, and it works very effectively when comparing between categories, eg. Gender, Party, etc.
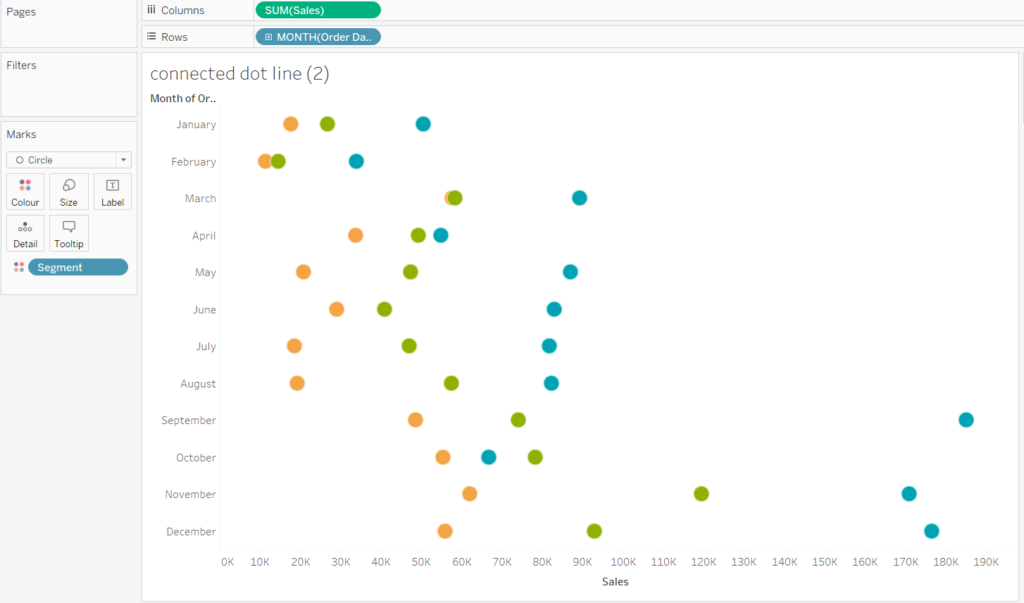
Step1: Put Dimensions and Measures on Columns and Rows, Category on Colour
Step2: Copy SUM(Sales) in the Columns, make it a Line Chart
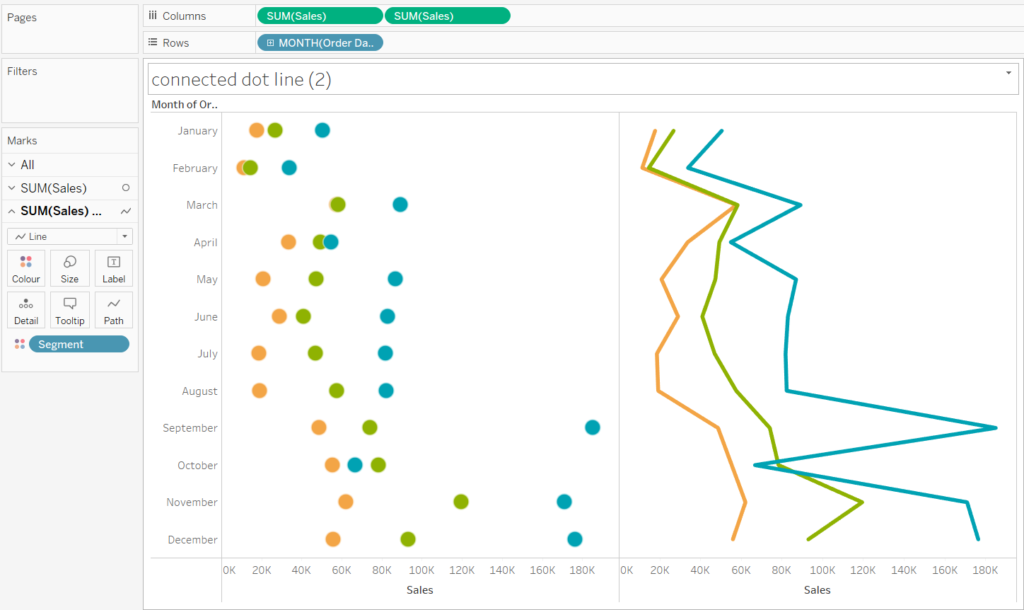
Step3: Move Category on Path

Step4: Dual Axis
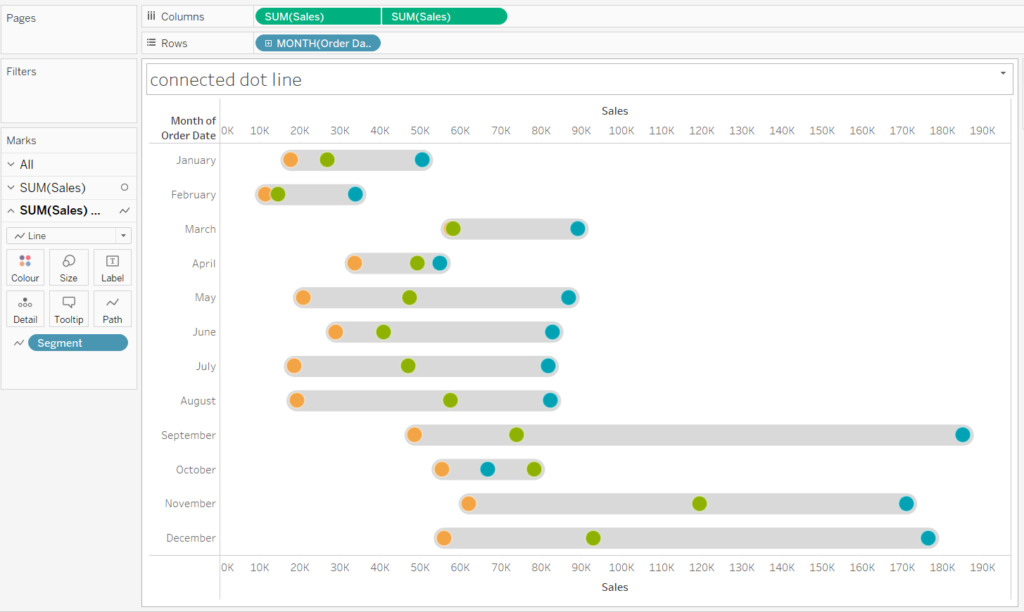
A bit formatting and it’s done!
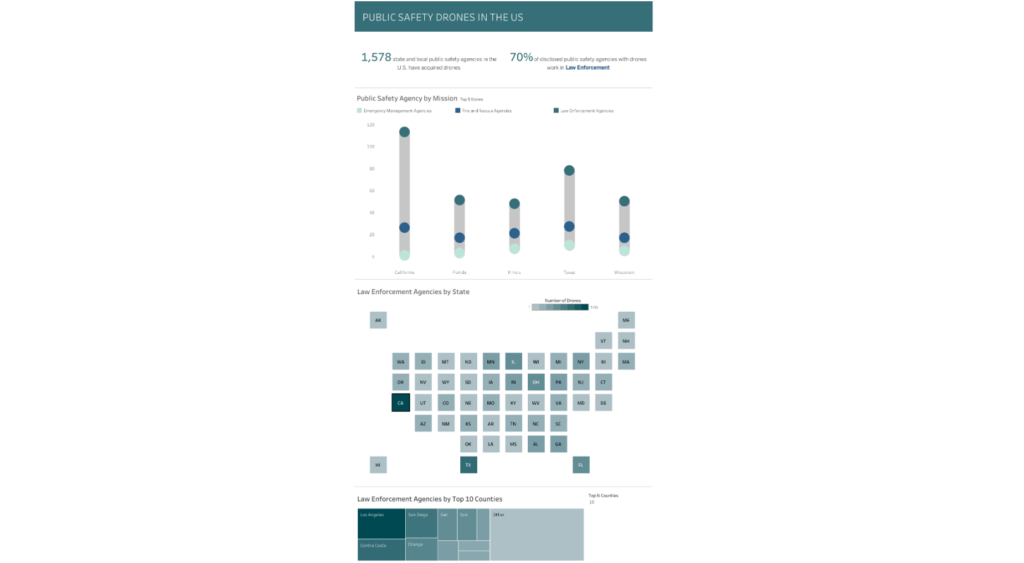
This is how I’ve used it in Dashboard Week Day 1: