


Tableau's Dynamic Zone Visibility (DZV) feature is a powerful tool that enables users to create interactive dashboards, enhancing data exploration and comprehension. In order to use DVZ, a field or a parameter must be a boolean, single value, or independent of the visualization, meaning the field returns a constant value independent of the structure of the visualization, such as a fixed level of detail (LOD) calculation. This blog will guide you through two step-by-step methods for implementing this powerful tool, enabling the creation of compelling and user-centric visualizations.
The Set-up
In this demo, I am using Tableau's Superstore data. I have started off by creating three sheets: a bar chart, a line chart, and a map.
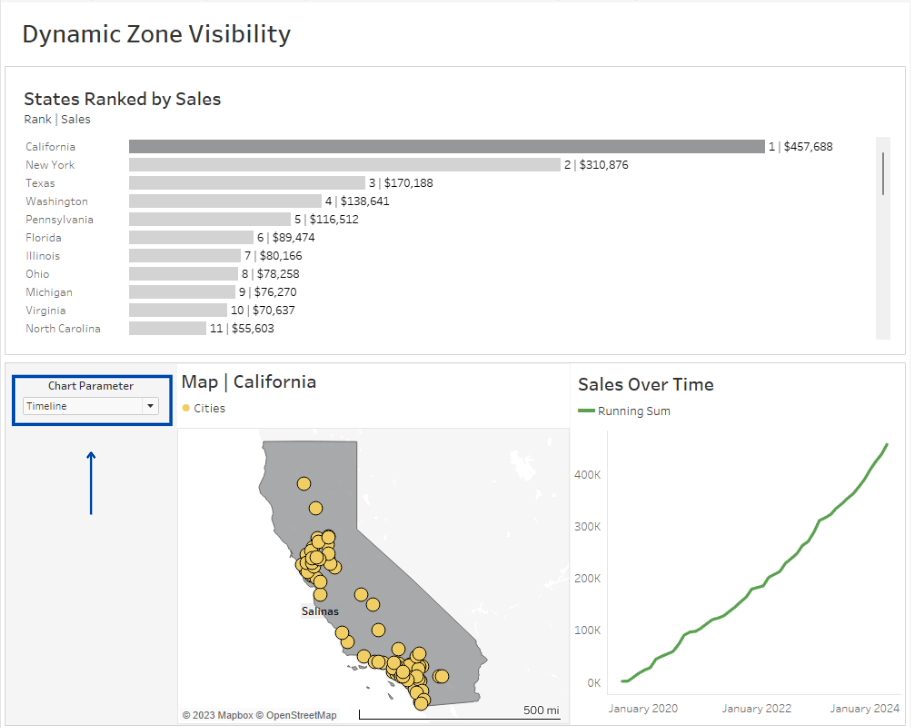
As you can see in View 1, I have laid out the three sheets onto a dashboard with a parameter action to allow me to filter the map and line chart based on a state selection from the bar chart. In this example, I want to accomplish two things:
- I would like to be able to only show one visual in the bottom container, either the map or the line chart. This will be done by using a Parameter and Calculated Fields.
- I would like to have the option to show/hide the bottom container so that the bar chart expands the entire length. This will be done by using just a Parameter.
Using Dynamic Zone Visibility with a Parameter and Calculated Fields
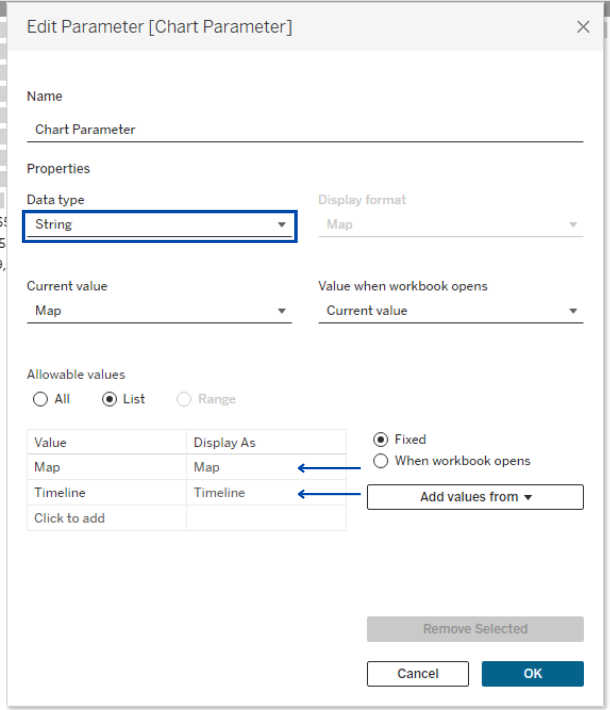
Step 1. Create a parameter. In this case, I want my parameter to allow me to toggle between two sheets.
- Add New Parameter, name it Chart Parameter
- Set the data type. I have chosen String since I want the user to choose either 'Map' or 'Timeline'.
- Input the values. For this example, 'Map' will point to my map sheet and 'Timeline' will point to my line chart sheet.
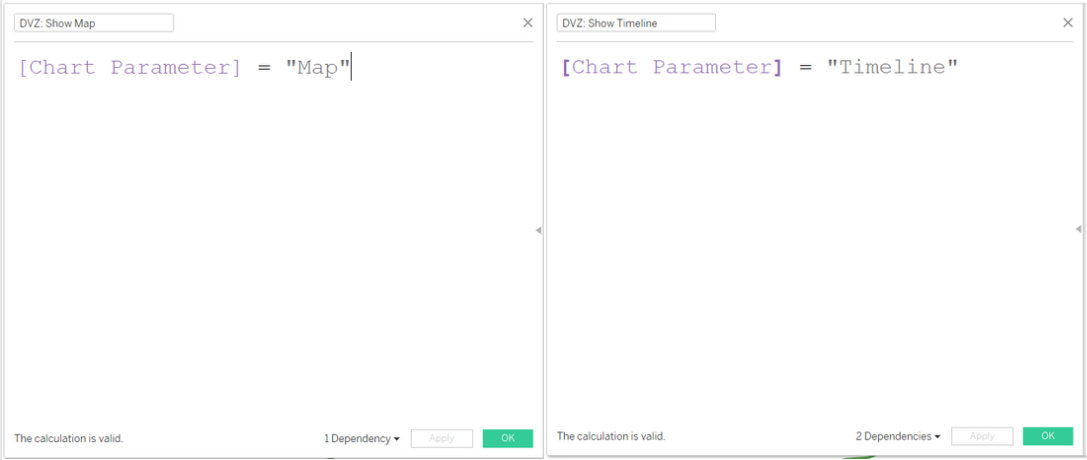
Step 2. Create two Calculated Fields. These Calculated Fields are what will be used for controlling the DZV, thus they need to be Booleans. We will need two for each sheet.
- Create calculated field called DVZ: Show Map, this returns true when my Chart Parameter equals 'Map'.
- Create another calculated field called DVZ: Show Timeline, this returns true when my Chart Parameter equals 'Timeline'.
Step 3. Add your parameter control to the dashboard. Here, I have arranged it within the area of the sheets it will be toggling between.
Step 4. Set up DVZ on your dashboard. This step is a little longer, but you can reference View 5.
- First, select the MAP sheet on the dashboard.
- Next, navigate to the Layout pane o the sidebar.
- Tick the Control Visibility Using checkbox.
- In the dropdown that appears, find in the list the calculated field DVZ: Show Map
- The MAP sheet is now set up, repeat this step for the TIMELINE sheet.
After you have successfully set up the DZV for both sheets, you are done! The Chart Parameter can now toggle between which sheet you are seeing!
Now let's see how we could use DVZ without a calculated field.
Using Dynamic Zone Visibility with just a Parameter
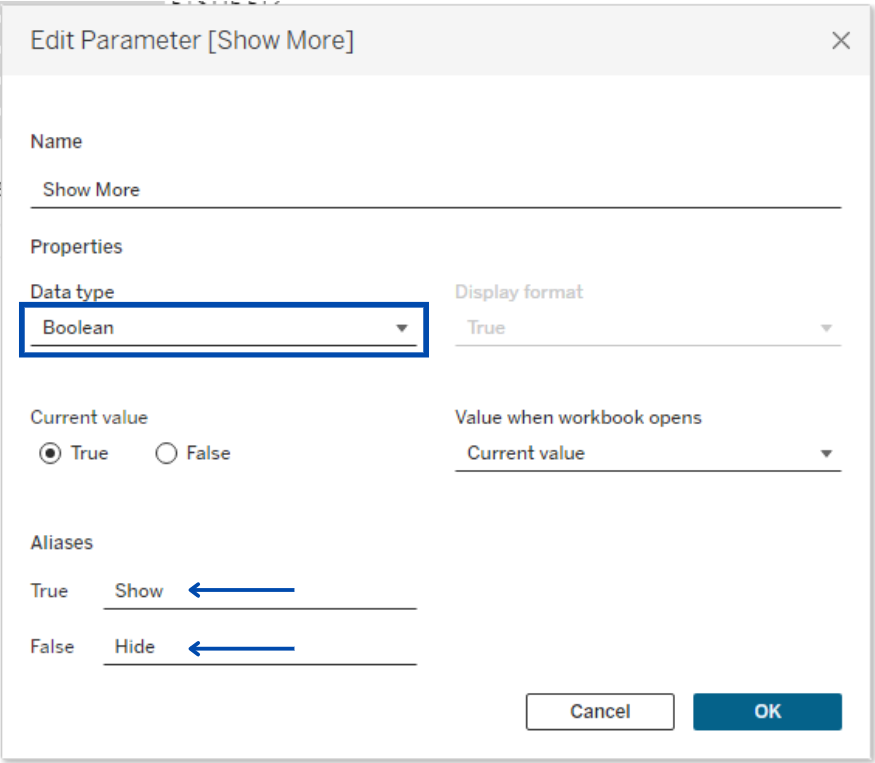
Step 1. Create a parameter. This time, we have to set the data type to Boolean or else we wont have access to it when setting up our DVZ.
- Add New Parameter, name it Show More
- Set the data type to Boolean.
- Alias what you want your true and false values to display. In this case, when the value is set to true, I want the dashboard to show the bottom visual, and when it is false, I want the bottom visual to disappear.
Step 2. Add your parameter control to the dashboard. By using a parameter to control the DVZ, we can skip the previous example's step 2 calculated field step.
Step 3. Set up DVZ on your dashboard. By using a parameter to control the DVZ, we can skip steps 2 from the previous example and go straight to step 3.
- Select what you will want the DZV to act on, in this case, I want the DZV to act upon the container that has my 2 sheets and Chart Parameter within it.
- Next, navigate to the Layout pane in the sidebar.
- Tick the Control Visibility Using checkbox.
- In the dropdown that appears, find and expand the Parameter menu and choose the parameter, Show More.
- The container is now set up and you should be able to show and hide the bottom portion of the dashboard by using the parameter.
DZV is a great tool that can elevate the storytelling of your data visualization.
I hope this helps! Happy Tableau-ing!
Photo by Majestic Lukas on Unsplash