In Tableau, did you know we are able to transform the values within our visualization directly? We can do this by implementing a special type of calculation, called table calculations. Whereas basic calculations work at the data source level of detail, table calculations work at the visualization’s level of detail. In this blog, we will go over the basics.
What are Table Calculations?
Table Calculations are a special type of calculated field that transforms the values within the visualization. In other words, the calculation will only be computed by using the data within the given view, taking into account dimensions and measures filtered out in the visualization.
Types of calculations that can be made may include:
- Difference From Calculations - Computes difference between current value and another value in the table.
- Moving (or rolling) Calculations - Determines value for a mark in the view by performing an aggregation across a specified number of values, either before or after the current value.
- Percent From Calculations - Computes value as a percentage of some other value for the marks within the view.
- Rank Calculations - Computes a ranking for each value within the partition.
There are three ways to create a table calculation:
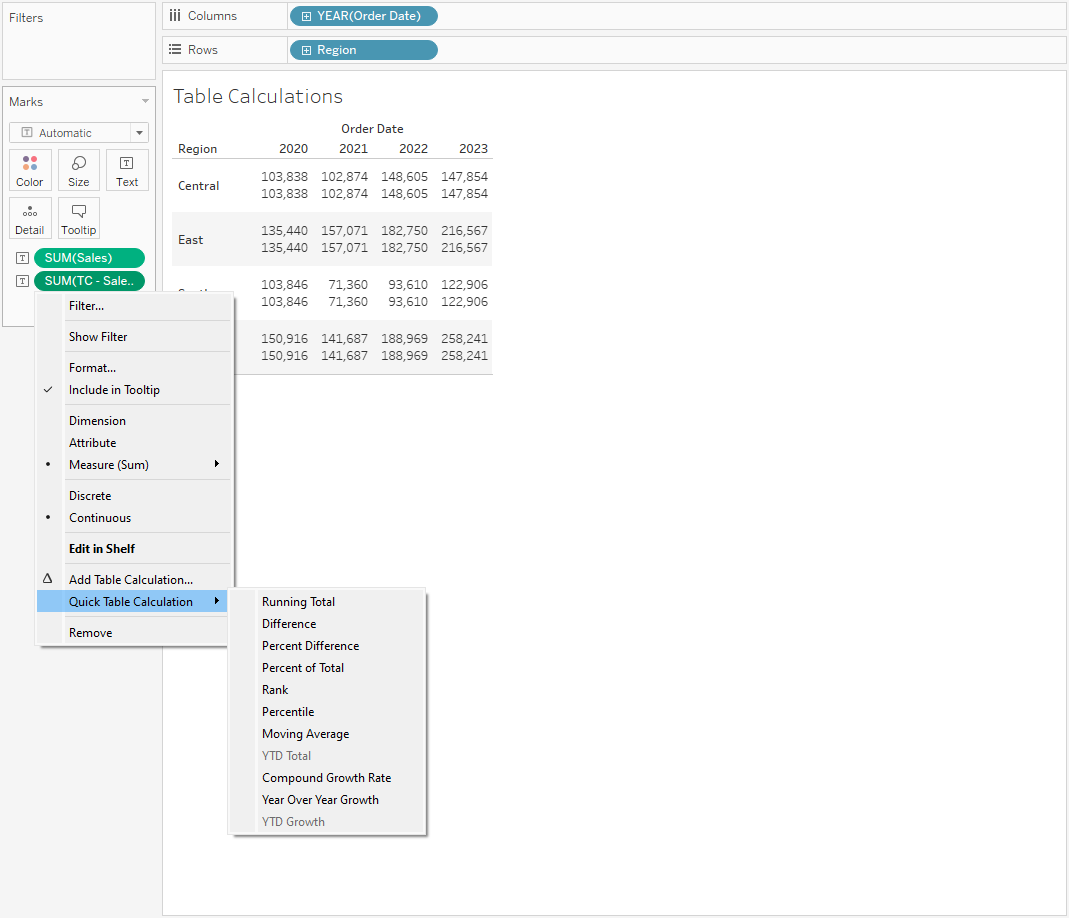
- Quick Table Calculation
This is the easiest and quickest approach, so that you can continue on with your analysis. This option will allow you to choose from a list of common calculations with the most typical settings.

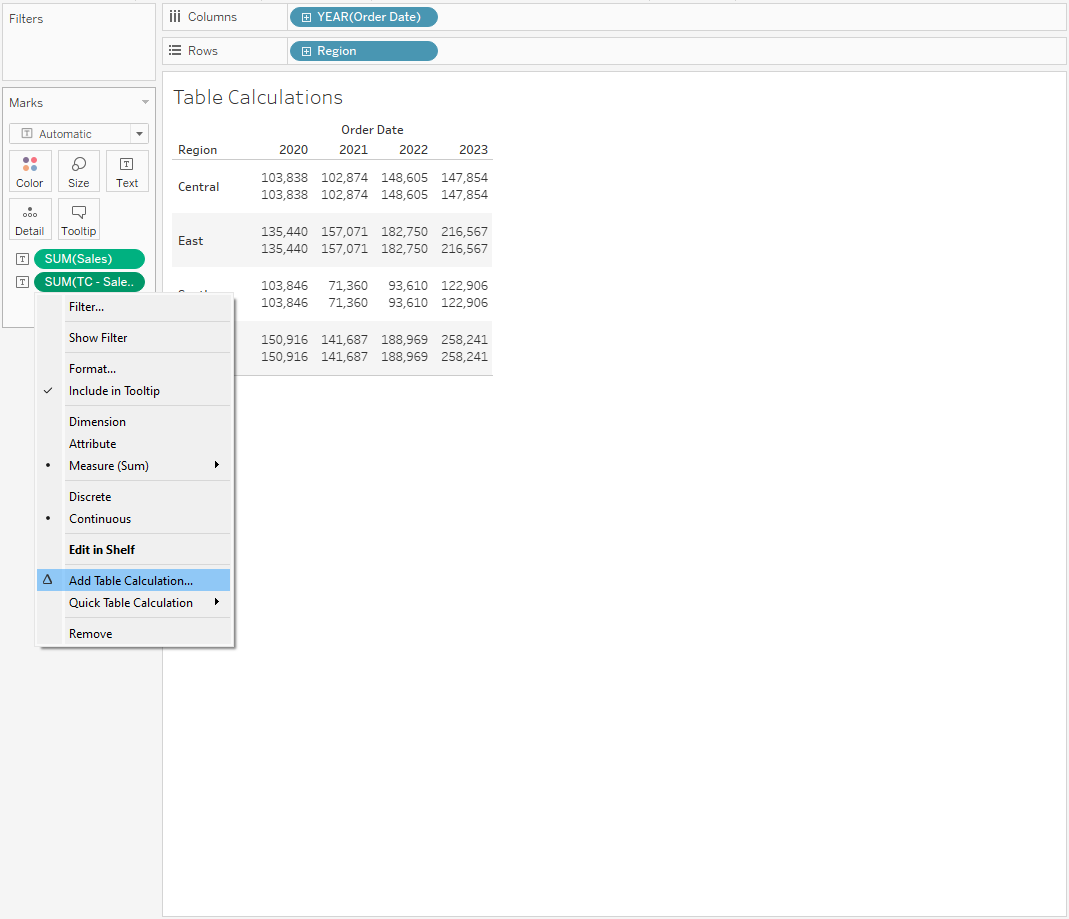
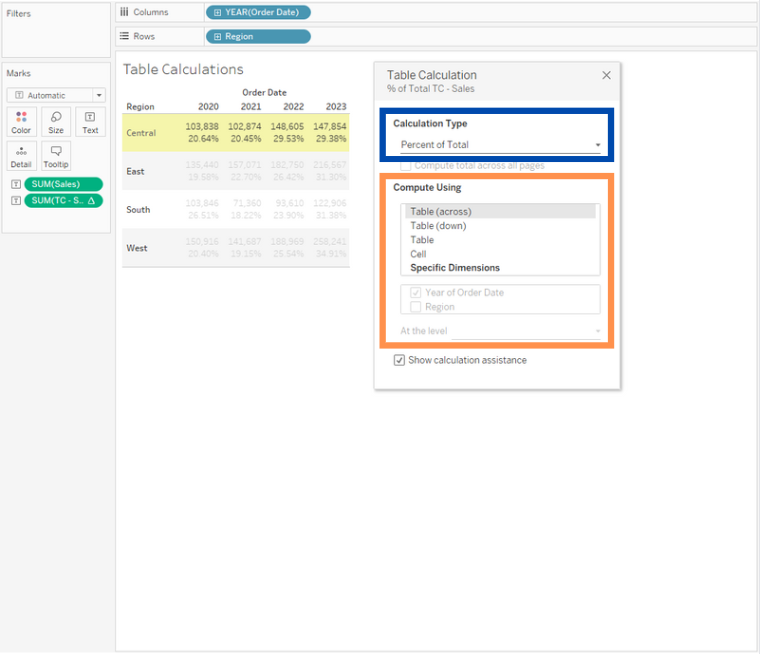
2. Add Table Calculation
This option will open up a window in which you can configure how you want the table calculation to act. The window will prompt you to choose the Calculation Type and a Compute Using option.


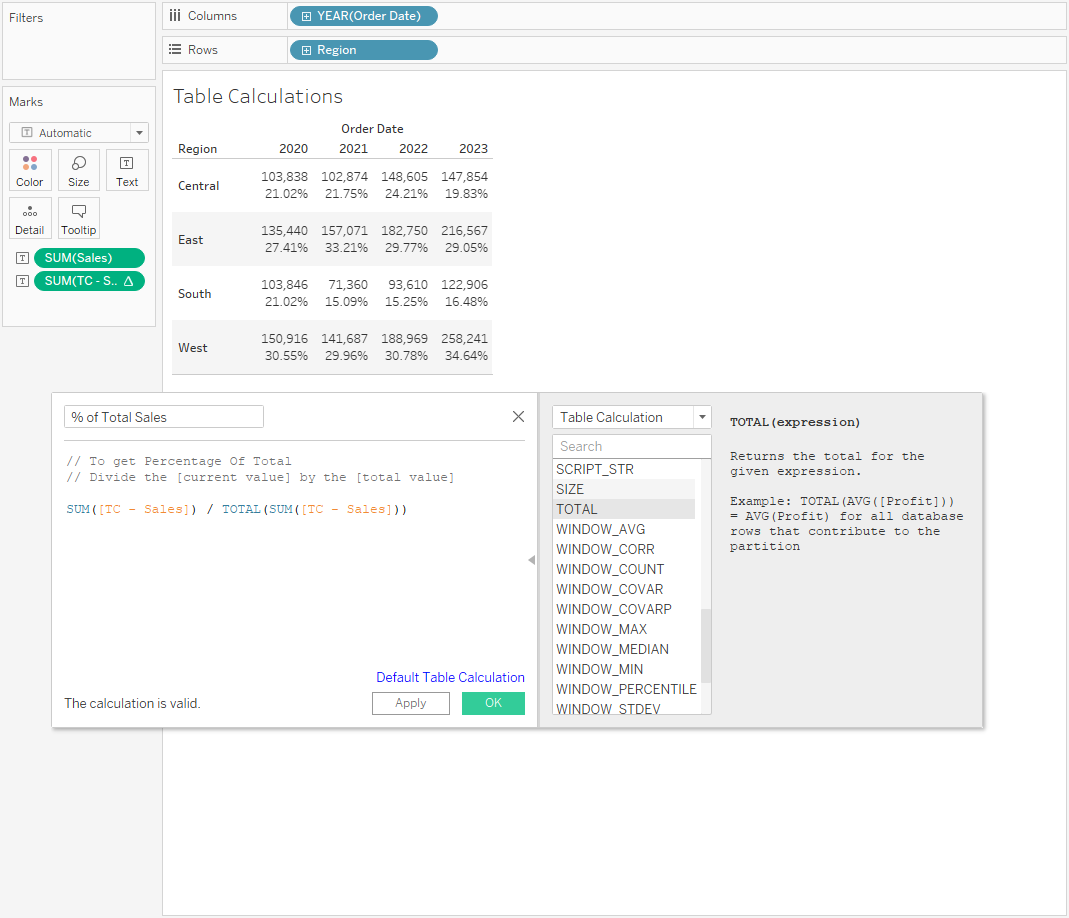
3. Calculated Field
Since a Table Calculation is a special type of calculated field, it would make sense that we have specific functions that we can utilize in our calculated field. Additionally, we are able to access other types of calculations such as referential [INDEX(), FIRST(), LAST()]and window specific values [WINDOW_MIN(), WINDOW_MAX()].

Summary
Table Calculations are a great way to add insights to any visualization. Now that you know the basics, stay tuned for Part Two, where we will focus on how to configure our table calculations.
Photo by Ali Yılmaz on Unsplash
