


If you are here, chances are, you are thinking about taking a dance with the Alteryx Designer Core Exam. Or maybe you are just starting out with Alteryx and want to take it step by step. Either way, if you want a quick look at the 23 core tools in Alteryx, you have come to the right place. In this blog, we will take a look at the core tools, which are divided within six "Palettes" in Alteryx. These are:
- In/Out
- Preparation
- Parse
- Join
- Transform
- Documentation
So using this order, let's break down the steps to using Alteryx.

In / Out
Browse allows us to connect to another tool and display its data. We are able to see profile information, maps, reports, and analytic information of the data.
The Input Data tool allows us to bring our dataset into our workflow, either by connecting to a database or reading from a file.
The Output Data compiles the data within the connected stream and sends it to either a file or database.
Text Input creates a new stream of data, independent of a separate file or database, that becomes part of the workflow. Contents of this new stream can be created directly in the workflow. This can eliminate the need to create a dataset in another program and inputting it to your workflow.
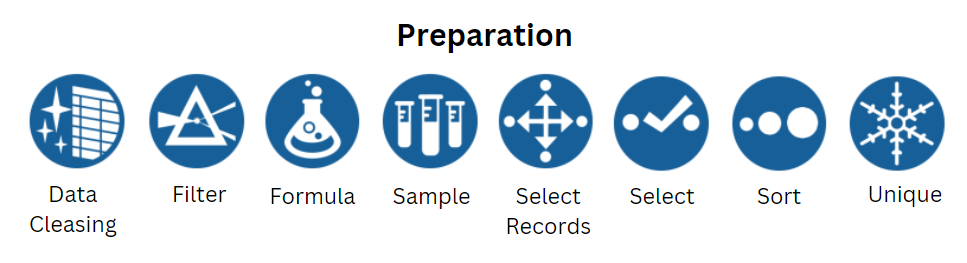
Preparation
Data Cleansing is a handy tool to clean up the dataset. Have leading or trailing spaces? Unwanted Punctuation? Need to do something about the null values? All these issues can be addressed with this tool.
Filter will take the connected stream and divide it into two streams marked by a "T" anchor and a "F" anchor. All records that meet the conditions of the filter will be filed in the "T" anchor and the records not met will be found in the "F" anchor.
Formula allows us to create a new column or update an existing one by performing various calculations.
Sort will arrange the records by alphanumerical order, ascending or descending, based on a single or multiple specified data fields.
Sample extracts a portion of the data stream based on a specified number, percentage, or randomized set of rows.
The Select tool allows us to control the data that moves downstream. We are able to exclude, rename, and add descriptions to columns. Modifications to data types and size of the data can also be done with this tool.
Select Records lets us extract precise records and range of records that are specified.
The Unique tool will take the connected stream and divide it into two outputs, the "U" anchor and "D" anchor. Based on the fields specified, if a record does not already exist in the "U" anchor, that record will be placed in the "U" anchor. Alternatively, if the record does exist in the "U" anchor, it will be placed in the "D" anchor.

Parse
The DateTime tool allows you to convert your data, whether you need to go from a string type to a date type or vice versa.
Text to Columns will take a string value from one column and split them into a specified amount of columns, or rows, based on one or many delimiters.

Join
The Join tool will take two inputs, "L" (left) and "R" (right), and combine the two based on specified common fields or record position. This will result in three possible outputs, "J" (join), "L", and "R". Any records that were able to be joined will be placed in the "J" output, whereas any record that was not able to be joined will be placed in their respective "L" or "R" outputs.
Append Fields will take two streams, connecting to the "T" (target) and "S" (source) input, and join them by appending every record in the "S" input to every record of the "T" input. The number of records that will be output will then be the product of "T" records and "S" records. For example, if the "T" input had 20 records, and the "S" input had 10 records, the output would have 200 records. This type of join is also called a Cartesian join.
Union can take multiple inputs and stack them on top of each other. Columns can be stacked or matched by name, position, or manually.
Find Replace takes a "F" (find) and "R" (replace) input. The tool will then look in the specified field within the "F" input and find a particular string and either replace the string or append a new column to the corresponding value in the "R" input.
Transform
Cross Tab will pivot data in a table from vertical to horizontal. While configuring, we will choose our grouping column, header column, and values column.
Transpose will then pivot data from horizontal to vertical, resulting in two new columns called Name and Value. Here, we can configure our key columns and data columns. The fields that are checked as a key column will remain on the horizontal axis and its values replicated for each data column chosen to be transposed. The transposed header will then be placed in the Name column and its value in the Value column.
The Summarize tool can use various calculations to aggregate a particular column. For example, this tool can help find the total sum of a column or even finding the total sum of individual groups within the dataset.

Documentation
The Comment tool allows us to add annotation to the canvas in which we can specify shape, font, and background color/image.
Tool Container allows us to section our workflow into containers. Containers can then be disabled, which will prevent tools within the containers from running. Additionally, containers can be minimized for organization.
Photo by Miguel Ángel Hernández on Unsplash