


Level of Detail (LOD) expressions can be technical, so this is the first of two posts. We begin with the basics.
Aside from table calculations, which I've written about here, and level of detail calculations, Tableau has two other calculation types. We start with these.
Row-Level and View-Level Calculations
Row-level Calculations
Calculations that reference unaggregated columns or fields are computed for each row in the underlying table. The dimensionality, or level of detail, for such expressions is row-level.
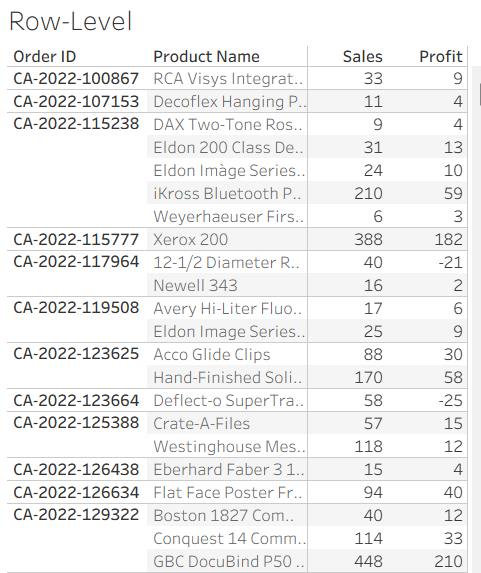
The level of detail of Tableau's Sample Superstore is Order ID, Product-level. Multiple products may be bought within the same order. Making a text-table with Order ID, Product Name, Sales and Profit:
A row-level Profit Ratio field is given by the following calculation:
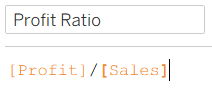
Bringing the measure into the table gives the expected result - the profit divided by the sales for each product within each order.
But what if we wanted to see the overall profit ratio, per region. Can we use the same row-level calculation? No.
As row-level calculations are computed for each row in the data, when other dimensions are added to the view - changing its level of detail or granularity - Tableau must aggregate those row-level values.
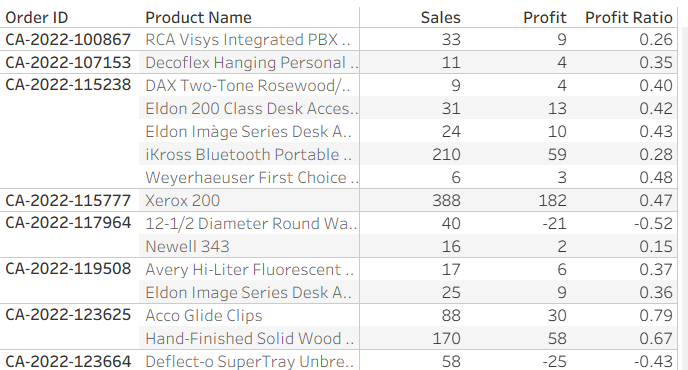
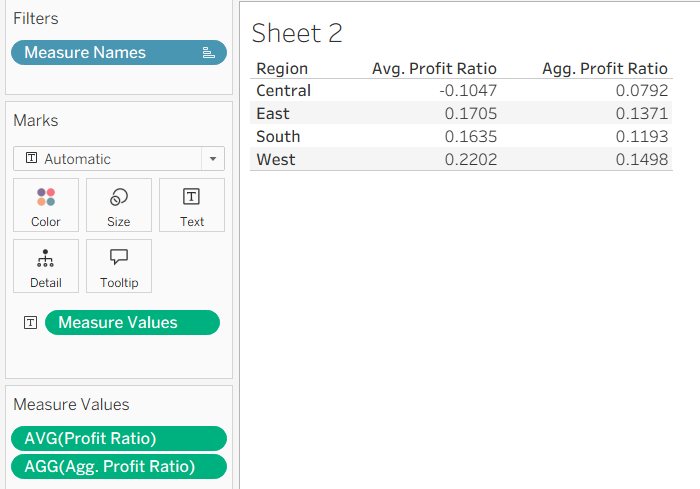
Creating a region-level text-table with the Profit Ratio field and changing the aggregation from SUM() to AVG() might make the values seem reasonable:
But this isn't what we want. The AVG(Profit Ratio) values being displayed are the averages of the row-level calculations we saw previously, grouped by region. What we want is the total profit divided by the total sales per region, not a regional aggregate of row-level values.
View-Level or Aggregate Calculations
Expressions referencing aggregated fields are computed at the granularity defined by the dimensions in the view.
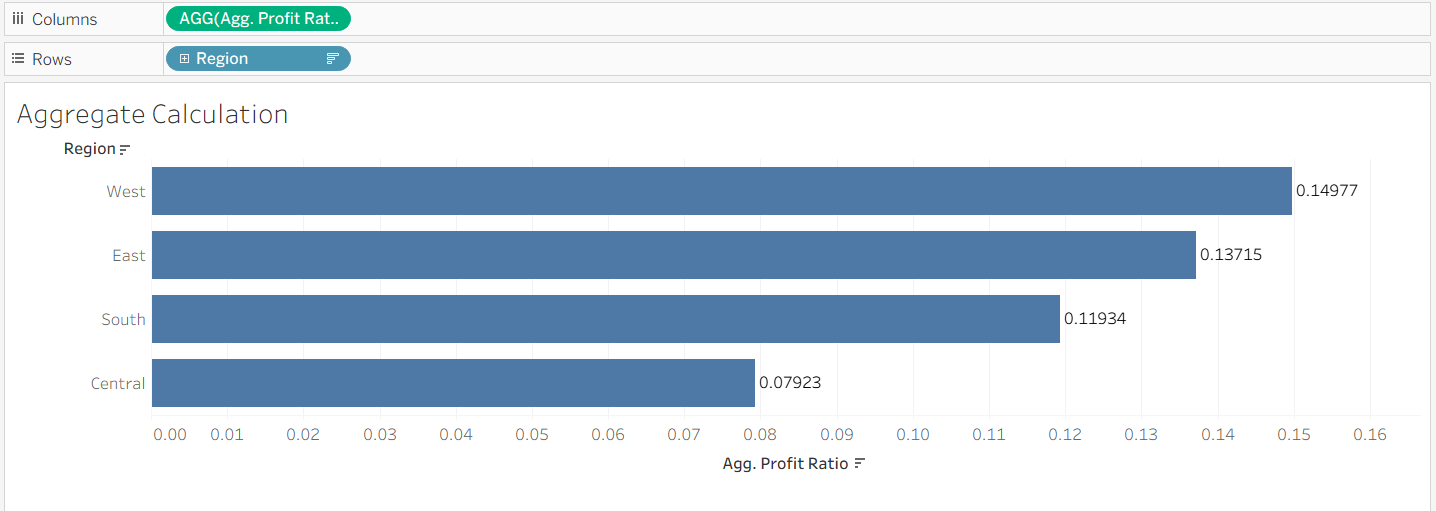
To calculate the profit ratio at the region-level, we make use of an aggregate calculation:
This calculation operates at the level of detail of the view. When the level of detail of the view is Region, Tableau computes the total profit and sales for each region, and then divides one by the other.
This gives us what we would typically want when asking for profit ratio by region.
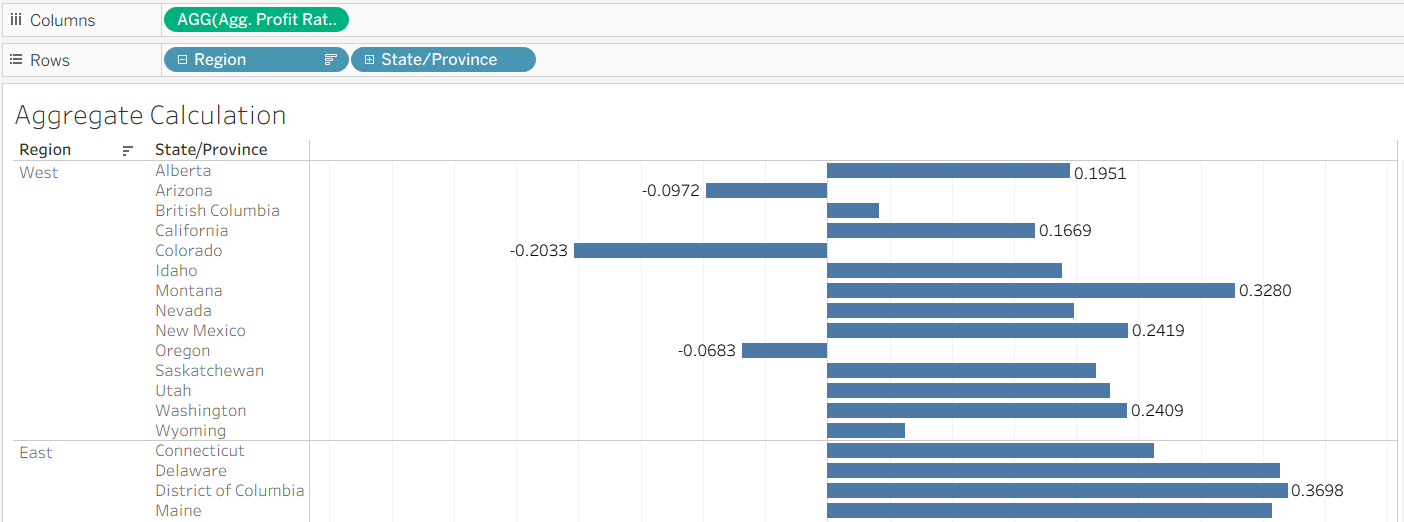
However, there is an important limitation. The result still depends on the structure of the view. If we add another dimension, such as State/Province, the level of aggregation changes and so does the result.
Compare the two images below. In the first, the profit ratio is aggregated at the region-level. In the second, State/Province - a more granular dimension - has been added, and so the calculation is performed at the State/Province-level.
But what if we wanted a calculation independent of the view, one which didn't change as we added more dimensions?
Level Of Detail Expressions
In both of the cases we've seen so far - row-level and aggregate calculations - the result depends on the dimensions in the view. LODs, by contrast, are calculated independent of the dimensions in the view.
The most basic type of LOD is a FIXED LOD. FIXED LODs 'fix' the level of detail of a calculation.
A general, FIXED LOD can be written using the following syntax:
{FIXED [Dimension]: AGG([Measure])}.
That is, a set of curly braces, the keyword FIXED followed by the dimension(s) that we'd like to fix our calculation to, a colon and an aggregate of the measure we want.
A Regional-level, FIXED LOD for Profit Ratio looks like this:
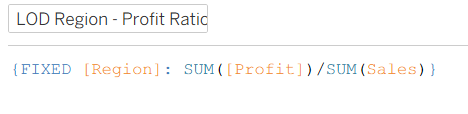
Tableau is computing the sum of Sales and sum of Profit per Region, and then dividing the two, and would display these values regardless of what other dimensions are in the view.
Adding State/Province to the view still displays the same Regional-level values we saw earlier:
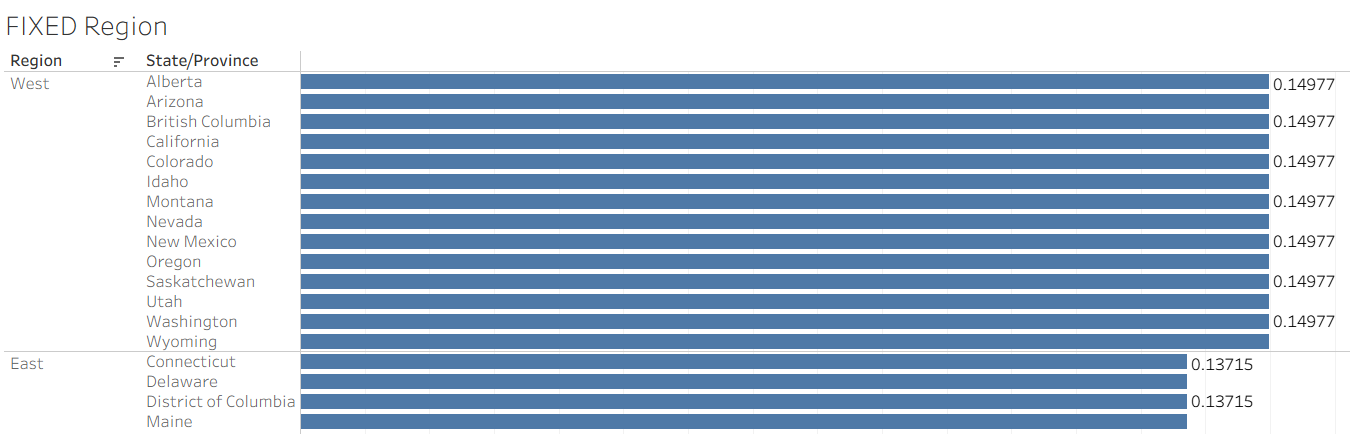
As the view is more granular than the calculation, Tableau repeats the same regional value for each State/Province in that region.
A natural question to ask here is: why would you ever want to bring a less granular value into a more granular view? Why would you ever want a regional-level calculation in a view at the State/Province level of detail?
Doing so allows for the comparison of values calculated at different levels of granularity within the same view.
Let's say that we wanted to compute the % or proportion of sales that each State/Province contributes to its Region's total sales. P.S. This can, arguably, be calculated more easily with a table calculation.
We'd need two things:
1. The Sales for each State/Province
2. The total Sales for each Region
And then we'd need to divide the former by the latter. The first is straightforward. If State/Province is in the view, SUM([Sales]) will be computed at the state-level as is. The second is not. If we use SUM([Sales]) again, we'd only get state-level values again. What we need, instead, is the total Sales for the region, repeated for each state within that region.
In comes a FIXED LOD:
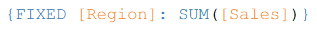
Which returns the total Sales for each region, regardless of the level of detail of the view.
The overall calculation for the proportion of Sales that each State/Province contributes to the total Sales for each Region is given by:
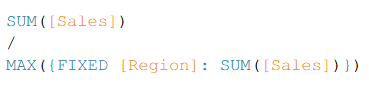
Where we have wrapped the FIXED LOD in a MAX() function so that Tableau doesn't throw the 'cannot mix aggregate and non-aggregate arguments within this function' error. Note that any aggregation method, like MIN(), AVG() or SUM() would return the same value, as a FIXED LOD returns the same value for every row (State/Province) within that region.
The numerator is computed at the view-level (State/Province). The denominator is computed at the region-level, as specified by the LOD. The result is the proportion of a Region's total Sales contributed by each State/Province.
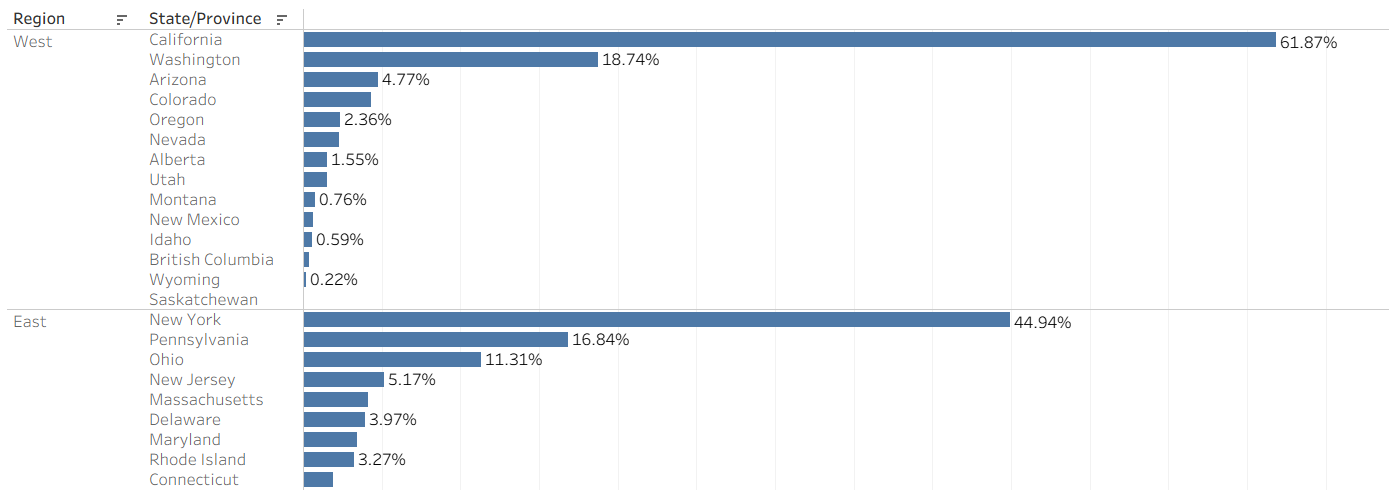
It is for this reason that the repeated values we saw earlier are not a flaw. They are what make this kind of comparison possible. Without the regional totals being available at the state-level, it would not have been possible to compute each state's contribution to its region.
Takeaway
FIXED LODs allow values to be computed at a level of detail different from that of the view.
This makes it possible to compare values across different levels of detail, rather than being constrained by the dimensions in the view.